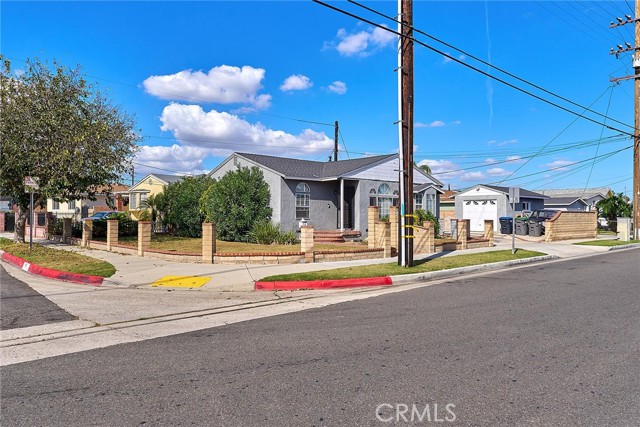
465 East 219th, Carson, CA 90745
465 East 219th, Carson, CA 90745
Property Description
Welcome to 465 E 219th Street, a beautifully transformed residence situated on a prime corner lot in central Carson. This home has been extensively upgraded throughout, featuring all-new electrical and new plumbing systems for complete peace of mind. Step inside to an entirely renovated interior showcasing an open, functional layout with modern finishes and abundant natural light. The heart of the home is a fully remodeled designer kitchen equipped with new cabinetry, sleek countertops, and ample prep space, opening seamlessly to the main living areas. Every detail across the interior has been refreshed, including updated flooring, crisp paint, and contemporary fixtures. The private, enclosed backyard offers excellent space for outdoor dining, entertaining, and recreation, while the prominent corner lot provides enhanced privacy, additional street access, and standout curb appeal. Centrally located near local parks, schools, retail, and easy commuter access to the 405, 110, and 91 freeways.
Features & Amenities
Property Details
Mortgage Calculator
Current Rates
Comparative Market Analysis
Affordable Tier · 5 active · 5 closed
Carson · Single Family Residence
Listed 3.5% above the median closed sale of $820,000. Closed comps sold at 102% of list — strong seller's market.
Price Position
Aligned with the market — fair pricing for the comps.
Active Properties (5)
Active Comparables
| Address | City | Year | BD | BTH | SqFt | LotSz | LP/SqFt | LP | DIM | Score |
|---|---|---|---|---|---|---|---|---|---|---|
| 361 224th | Carson | 1951 | 4 | 3 | 1,588 | 5,066 | $554 | $879,000 | 107 | 79 |
| 237 219th | Carson | 1957 | 3 | 3 | 1,657 | 5,545 | $453 | $750,000 | 30 | 74 |
| 181 223rd Street | Carson | 1961 | 4 | 2 | 1,778 | 8,027 | $517 | $920,000 | 52 | 74 |
| 108 229th Place | Carson | 1967 | 4 | 2 | 2,188 | 4,851 | $441 | $965,000 | 31 | 64 |
| 305 220th Street | Carson | 1983 | 4 | 3 | 1,982 | 3,796 | $403 | $799,000 | 1514 | 48 |
| Total: 5 · Average | 3.8 | 2.6 | 1,838.6 | 5,457 | $473.6 | $862,600 | 346.8 | |||
| Median | 1,778 | $879,000 | ||||||||
Closed Properties (5)
Closed Comparables
| Address | City | Year | Date | BD | BTH | SqFt | LotSz | LP | SP | SP/SqFt | SP/LP | DIM | Score |
|---|---|---|---|---|---|---|---|---|---|---|---|---|---|
| 22024 Gulf Avenue | Carson | 1955 | 10/28/2026 | 4 | 3 | 1,216 | 5,286 | $899,000 | $890,000 | $732 | 0.99 | 21 | 89 |
| 536 220TH | Carson | 1950 | 03/31/2026 | 3 | 1 | 1,276 | 5,543 | $787,000 | $812,000 | $636 | 1.03 | 41 | 88 |
| 22418 Neptune Avenue | Carson | 1951 | 07/28/2026 | 3 | 2 | 1,205 | 4,969 | $769,000 | $820,000 | $680 | 1.07 | 52 | 86 |
| 22433 Island | Carson | 1951 | 06/30/2026 | 3 | 1 | 980 | 4,992 | $765,000 | $775,000 | $791 | 1.01 | 96 | 86 |
| 22025 Garston Avenue | Carson | 1956 | 06/30/2026 | 4 | 2 | 1,510 | 5,335 | $895,000 | $895,000 | $593 | 1.00 | 124 | 83 |
| Total: 5 · Average | 3.4 | 1.8 | 1,237.4 | 5,225 | $838,400 | $838,400 | $686.4 | — | 66.8 | ||||
| Median | 1,216 | $820,000 | $820,000 | ||||||||||
Market Analysis
List vs Sale $/SqFt
Sale Price Trend
Days on Market
Sale vs List Price
This analysis was generated automatically from MLS data. For an in-depth, human-reviewed valuation, contact Joseph Sardella at josephsardella@gmail.com.