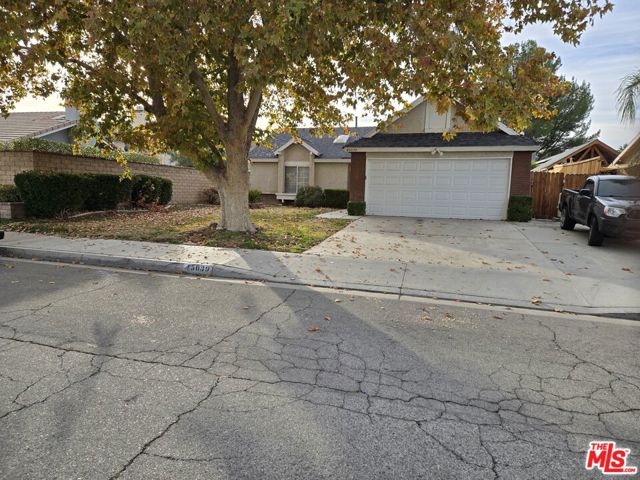
45039 Rachel Avenue, Lancaster, CA 93535
45039 Rachel Avenue, Lancaster, CA 93535
Property Description
Great Opportunity Fixer with Huge Potential! This home offers a fantastic opportunity for buyers looking to add their personal touch. Featuring a solid layout and great bones, this property is ready for some updates including interior/exterior paint and new flooring. Perfect for investors, flippers, or homeowners looking to build equity. Located in a desirable area with strong upside potential. Price to sell don't miss this chance to turn this house into your dream home or next investment! This property is sold as is.
Features & Amenities
Property Details
Mortgage Calculator
Current Rates
Comparative Market Analysis
Affordable Tier · 5 active · 5 closed
Lancaster · Single Family Residence
Listed 9.0% below the median closed sale of $390,000. Price per sqft ($336) is a 10% premium to closed comps ($305).
Price Position
Priced below the market — value advantage over the field.
Active Properties (5)
Active Comparables
| Address | City | Year | BD | BTH | SqFt | LotSz | LP/SqFt | LP | DIM | Score |
|---|---|---|---|---|---|---|---|---|---|---|
| 45311 Century | Lancaster | 1989 | 3 | 2 | 1,068 | 6,216 | $351 | $375,000 | 39 | 86 |
| 1004 Lightcap | Lancaster | 1985 | 2 | 2 | 1,149 | 7,837 | $326 | $375,000 | 23 | 85 |
| 1008 Newgrove | Lancaster | 1983 | 3 | 2 | 1,160 | 7,338 | $345 | $400,000 | 11 | 83 |
| 1800 Sierra View | Lancaster | 1990 | 3 | 2 | 1,316 | 6,097 | $304 | $399,999 | 11 | 82 |
| 44846 Andale Avenue | Lancaster | 1957 | 3 | 2 | 1,107 | 7,841 | $334 | $369,900 | 15 | 74 |
| Total: 5 · Average | 2.8 | 2.0 | 1,160 | 7,065.8 | $332 | $383,979.8 | 19.8 | |||
| Median | 1,149 | $375,000 | ||||||||
Closed Properties (5)
Closed Comparables
| Address | City | Year | Date | BD | BTH | SqFt | LotSz | LP | SP | SP/SqFt | SP/LP | DIM | Score |
|---|---|---|---|---|---|---|---|---|---|---|---|---|---|
| 45041 17th Street | Lancaster | 1988 | 11/24/2025 | 3 | 2 | 1,282 | 5,662 | $409,900 | $400,000 | $312 | 0.98 | 49 | 83 |
| 2028 Greentree | Lancaster | 1993 | 08/05/2026 | 3 | 2 | 1,222 | 5,575 | $335,000 | $335,000 | $274 | 1.00 | 22 | 82 |
| 44605 Gillan Avenue | Lancaster | 1983 | 07/20/2026 | 3 | 2 | 1,134 | 8,168 | $390,000 | $390,000 | $344 | 1.00 | 48 | 80 |
| 1003 Lightcap Street | Lancaster | 1985 | 11/11/2025 | 2 | 2 | 1,201 | 7,435 | $383,800 | $390,000 | $325 | 1.02 | 82 | 79 |
| 45403 8th | Lancaster | 1990 | 09/24/2026 | 3 | 2 | 1,354 | 6,014 | $365,000 | $365,000 | $270 | 1.00 | 50 | 78 |
| Total: 5 · Average | 2.8 | 2.0 | 1,238.6 | 6,570.8 | $376,000 | $376,000 | $305 | — | 50.2 | ||||
| Median | 1,222 | $390,000 | $390,000 | ||||||||||
Market Analysis
List vs Sale $/SqFt
Sale Price Trend
Days on Market
Sale vs List Price
This analysis was generated automatically from MLS data. For an in-depth, human-reviewed valuation, contact Joseph Sardella at josephsardella@gmail.com.