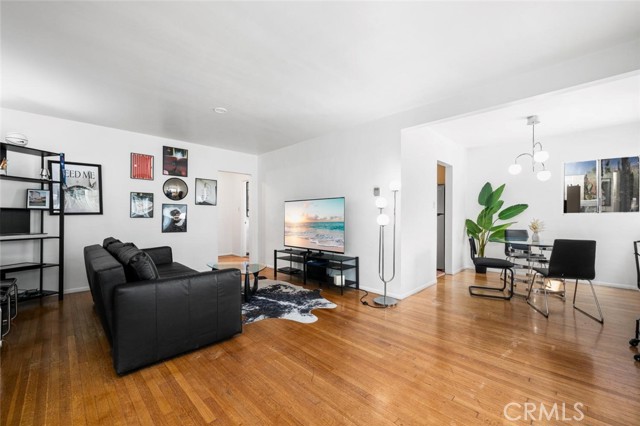
438 Cedar, 7, Long Beach, CA 90802
438 Cedar, 7, Long Beach, CA 90802
Property Description
Welcome to Cedarhurst in the heart of Downtown Long Beach! This bright and spacious ground-floor end unit offers 748 sq. ft., one bedroom, one bathroom, abundant natural light, and beautiful hardwood floors. The kitchen features quartz countertops, ample cabinetry, and a newer sink and faucet. The oversized bedroom includes a walk-in closet, while the refreshed bathroom offers an updated vanity, lighting and flooring. Enjoy the building’s palm-lined courtyard and a highly walkable location near Pine Avenue, Ocean Boulevard, The Promenade, Shoreline Village, restaurants, shopping, entertainment, public transit, and freeway access. Monthly parking options are available nearby through the City. Potential to add in-unit laundry hookups with HOA approval.
Features & Amenities
Property Details
Mortgage Calculator
Current Rates
Comparative Market Analysis
Affordable Tier · 5 active · 5 closed
Long Beach · Condominium
Listed in line with the median closed sale of $339,000. Price per sqft ($455) is a 13% discount to closed comps ($524).
Price Position
Aligned with the market — fair pricing for the comps.
Active Properties (5)
Active Comparables
| Address | City | Year | BD | BTH | SqFt | LotSz | LP/SqFt | LP | DIM | Score |
|---|---|---|---|---|---|---|---|---|---|---|
| 438 Cedar | Long Beach | 1957 | 1 | 1 | 849 | 15,007 | $412 | $349,900 | 48 | 94 |
| 728 Cedar | Long Beach | 1956 | 1 | 1 | 611 | 15,036 | $538 | $329,000 | 4 | 92 |
| 527 Cedar Avenue | Long Beach | 1961 | 2 | 1 | 809 | 15,006 | $445 | $360,000 | 3 | 91 |
| 545 Chestnut Avenue | Long Beach | 1972 | 1 | 1 | 666 | 20,550 | $477 | $317,888 | 18 | 88 |
| 338 Elm Avenue | Long Beach | 1958 | 1 | 1 | 643 | 7,472 | $466 | $299,900 | 143 | 87 |
| Total: 5 · Average | 1.2 | 1.0 | 715.6 | 14,614.2 | $467.6 | $331,337.6 | 43.2 | |||
| Median | 666 | $329,000 | ||||||||
Closed Properties (5)
Closed Comparables
| Address | City | Year | Date | BD | BTH | SqFt | LotSz | LP | SP | SP/SqFt | SP/LP | DIM | Score |
|---|---|---|---|---|---|---|---|---|---|---|---|---|---|
| 528 Cedar Boulevard | Long Beach | 1960 | 06/05/2026 | 1 | 1 | 812 | 17,363 | $329,000 | $315,000 | $388 | 0.96 | 60 | 92 |
| 527 Cedar Avenue | Long Beach | 1961 | 02/12/2026 | 1 | 1 | 597 | 15,006 | $339,000 | $333,000 | $558 | 0.98 | 75 | 89 |
| 350 Cedar Avenue | Long Beach | 1971 | 03/03/2026 | 1 | 1 | 667 | 10,635 | $339,000 | $339,000 | $508 | 1.00 | 49 | 86 |
| 438 Cedar | Long Beach | 1957 | 02/10/2026 | 1 | 1 | 574 | 15,007 | $389,000 | $389,000 | $678 | 1.00 | 34 | 84 |
| 315 3rd Street | Long Beach | 1925 | 11/13/2025 | 1 | 1 | 759 | 22,493 | $380,000 | $370,000 | $487 | 0.97 | 39 | 81 |
| Total: 5 · Average | 1.0 | 1.0 | 681.8 | 16,100.8 | $349,200 | $349,200 | $523.8 | — | 51.4 | ||||
| Median | 667 | $339,000 | $339,000 | ||||||||||
Market Analysis
List vs Sale $/SqFt
Sale Price Trend
Days on Market
Sale vs List Price
This analysis was generated automatically from MLS data. For an in-depth, human-reviewed valuation, contact Joseph Sardella at josephsardella@gmail.com.