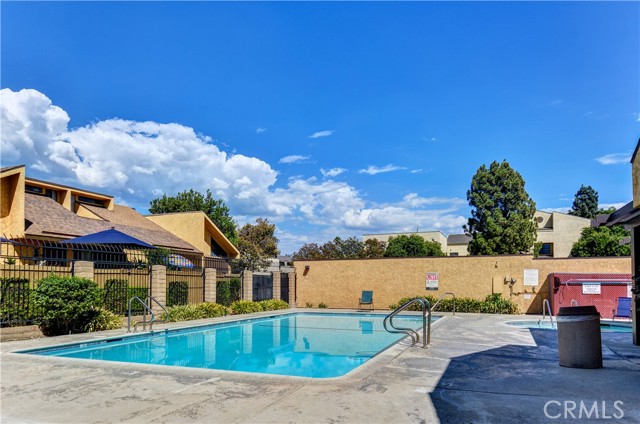
435 West 9th, E1, Upland, CA 91786
435 West 9th, E1, Upland, CA 91786
Property Description
HUGE PRICE REDUCTION....435 E. 9th Unit E1.......Located towards the back of the community.....LOOK AT THIS PRICE!! This charming 2 bedroom, 2 bathroom is the perfect opportunity to buy a gorgeous home in Southern California. This home offers 1 bedoom, 1 bathroom downstairs and one bedroom with bathroom upstairs. Some recent upgrades are new paint, vanity and tile. A few features central air conditioning, forced heat, ample kitchen cabinets, high ceilings, 2- car detached garage with remote, enclosed patio area, and more. The complex is extremely well maintained and offers open space, pool, club house, and a laundry facility. This home is conveniently located north of the 10 freeway, near Downtown Upland, parks, restaurants, and entertainment.
Features & Amenities
Property Details
Mortgage Calculator
Current Rates
Comparative Market Analysis
Affordable Tier · 5 active · 5 closed
Upland · Condominium
Listed 8.2% below the median closed sale of $425,000.
Price Position
Priced below the market — value advantage over the field.
Active Properties (5)
Active Comparables
| Address | City | Year | BD | BTH | SqFt | LotSz | LP/SqFt | LP | DIM | Score |
|---|---|---|---|---|---|---|---|---|---|---|
| 1397 7th | Upland | 1974 | 2 | 1 | 994 | 994 | $407 | $405,000 | 24 | 83 |
| 108 Stillman Way | Upland | 1971 | 2 | 1 | 882 | 0 | $448 | $395,000 | 27 | 82 |
| 377 Spencer | Upland | 1974 | 2 | 1 | 994 | 994 | $412 | $409,900 | 64 | 82 |
| 128 Stillman Way | Upland | 1971 | 2 | 1 | 840 | 800 | $415 | $349,000 | 86 | 78 |
| 9382 Shadowood Drive | Montclair | 1980 | 2 | 2 | 1,053 | 925 | $412 | $434,000 | 26 | 74 |
| Total: 5 · Average | 2.0 | 1.2 | 952.6 | 928.25 | $418.8 | $398,580 | 45.4 | |||
| Median | 994 | $405,000 | ||||||||
Closed Properties (5)
Closed Comparables
| Address | City | Year | Date | BD | BTH | SqFt | LotSz | LP | SP | SP/SqFt | SP/LP | DIM | Score |
|---|---|---|---|---|---|---|---|---|---|---|---|---|---|
| 579 9th | Upland | 1979 | 07/17/2026 | 2 | 2 | 1,017 | 1,017 | $425,000 | $425,000 | $418 | 1.00 | 88 | 95 |
| 537 9th Street | Upland | 1979 | 12/11/2025 | 2 | 2 | 1,017 | 1,017 | $449,995 | $445,000 | $438 | 0.99 | 72 | 91 |
| 1328 8th Street | Upland | 1972 | 06/15/2026 | 2 | 2 | 969 | 969 | $449,900 | $443,500 | $458 | 0.99 | 59 | 84 |
| 1089 Pine | Upland | 1972 | 05/14/2026 | 2 | 2 | 1,023 | 1,092 | $419,900 | $415,000 | $406 | 0.99 | 91 | 84 |
| 1397 Fredericks | Upland | 1974 | 10/02/2026 | 2 | 1 | 994 | 994 | $407,000 | $415,000 | $418 | 1.02 | 49 | 83 |
| Total: 5 · Average | 2.0 | 1.8 | 1,004 | 1,017.8 | $428,700 | $428,700 | $427.6 | — | 71.8 | ||||
| Median | 1,017 | $425,000 | $425,000 | ||||||||||
Market Analysis
List vs Sale $/SqFt
Sale Price Trend
Days on Market
Sale vs List Price
This analysis was generated automatically from MLS data. For an in-depth, human-reviewed valuation, contact Joseph Sardella at josephsardella@gmail.com.