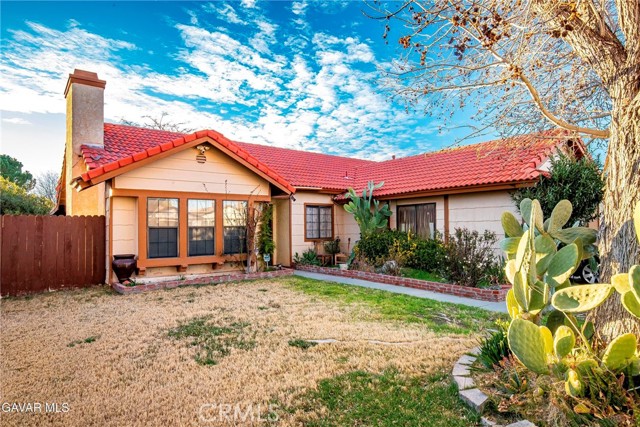
43319 27th West, Lancaster, CA 93536
43319 27th West, Lancaster, CA 93536
Property Description
WEST LANCASTER HOME WITH TILE ROOF. This home features a Cozy Fireplace and Crown Molding in the Spacious Living Room. The kitchen is large with lots of Cabinets and Countertops. You'll really appreciate the newer Stainless Appliances. In back is a Covered Patio and on the side possible RV parking with lots of paved storage. This property will qualify for FHA 203K that lets you buy a home and finance the renovations with one loan!
Features & Amenities
Property Details
Mortgage Calculator
Current Rates
Comparative Market Analysis
Affordable Tier · 5 active · 5 closed
Lancaster · Single Family Residence
Listed 7.5% above the median closed sale of $400,000. Closed comps sold at 100% of list — strong seller's market.
Price Position
Positioned above the market — commands a premium.
Active Properties (5)
Active Comparables
| Address | City | Year | BD | BTH | SqFt | LotSz | LP/SqFt | LP | DIM | Score |
|---|---|---|---|---|---|---|---|---|---|---|
| 2808 College Park | Lancaster | 1987 | 3 | 2 | 1,525 | 7,027 | $319 | $486,000 | 173 | 90 |
| 43337 Fanchon | Lancaster | 1973 | 3 | 2 | 1,476 | 7,401 | $309 | $455,900 | 11 | 89 |
| 3129 Brentwood | Lancaster | 1980 | 3 | 2 | 1,064 | 6,662 | $399 | $424,999 | 5 | 88 |
| 2317 Edam Street | Lancaster | 1999 | 4 | 2 | 1,403 | 8,347 | $320 | $449,000 | 44 | 82 |
| 44050 27th | Lancaster | 1973 | 3 | 2 | 1,406 | 8,234 | $320 | $449,900 | 132 | 81 |
| Total: 5 · Average | 3.2 | 2.0 | 1,374.8 | 7,534.2 | $333.4 | $453,159.8 | 73 | |||
| Median | 1,406 | $449,900 | ||||||||
Closed Properties (5)
Closed Comparables
| Address | City | Year | Date | BD | BTH | SqFt | LotSz | LP | SP | SP/SqFt | SP/LP | DIM | Score |
|---|---|---|---|---|---|---|---|---|---|---|---|---|---|
| 43354 Fanchon Avenue | Lancaster | 1973 | 10/14/2026 | 3 | 2 | 1,315 | 6,653 | $420,000 | $400,000 | $304 | 0.95 | 55 | 92 |
| 43240 32nd Street | Lancaster | 1980 | 07/29/2026 | 3 | 2 | 1,250 | 7,423 | $449,000 | $450,000 | $360 | 1.00 | 46 | 89 |
| 42954 Fanchon Avenue | Lancaster | 1991 | 10/12/2026 | 3 | 2 | 1,491 | 7,998 | $449,000 | $470,000 | $315 | 1.05 | 48 | 88 |
| 2839 Dartmouth Drive | Lancaster | 1984 | 06/08/2026 | 3 | 2 | 1,314 | 2,178 | $379,000 | $379,000 | $288 | 1.00 | 67 | 88 |
| 2816 Dartmouth | Lancaster | 1985 | 12/08/2025 | 3 | 3 | 1,452 | 2,166 | $395,000 | $400,000 | $275 | 1.01 | 37 | 81 |
| Total: 5 · Average | 3.0 | 2.2 | 1,364.4 | 5,283.6 | $419,800 | $419,800 | $308.4 | — | 50.6 | ||||
| Median | 1,315 | $400,000 | $400,000 | ||||||||||
Market Analysis
List vs Sale $/SqFt
Sale Price Trend
Days on Market
Sale vs List Price
This analysis was generated automatically from MLS data. For an in-depth, human-reviewed valuation, contact Joseph Sardella at josephsardella@gmail.com.