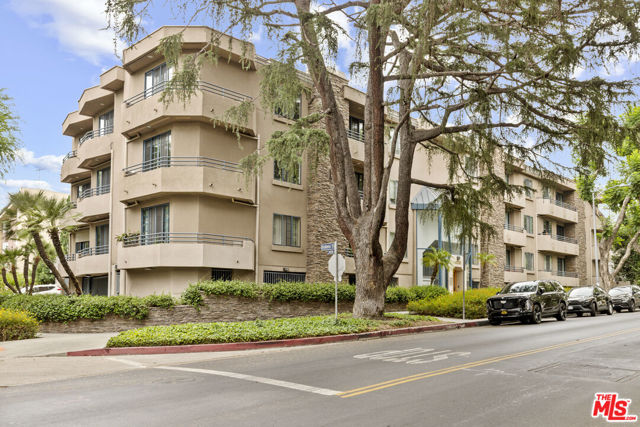
4230 Stansbury Avenue, 105, Sherman Oaks, CA 91423
4230 Stansbury Avenue, 105, Sherman Oaks, CA 91423
Property Description
This Spacious and inviting, 1,689 SF condominum in the heart of Sherman Oaks, offers an open floor plan with exceptional versatility. Featuring 2 bedrooms, 2 bathrooms, and a den with a closet that can easily serve as a 3rd bedroom, this home is designed for both comfort and flexibility. The living room with a cozy fireplace flows seamlessly to a private balcony, perfect for relaxing or entertaining. The kitchen boasts abundant cabinet space, providing ample storage. Secured two parking spaces, side by side, Located on one of the best quiet tree lined strees, close to Ventura, shops, restaurants, and all the best of Sherman Oaks.
Features & Amenities
Property Details
Mortgage Calculator
Current Rates
Comparative Market Analysis
Residential Tier · 5 active · 5 closed
Sherman Oaks · Condominium
Listed 8.1% below the median closed sale of $865,000.
Price Position
Priced below the market — value advantage over the field.
Active Properties (5)
Active Comparables
| Address | City | Year | BD | BTH | SqFt | LotSz | LP/SqFt | LP | DIM | Score |
|---|---|---|---|---|---|---|---|---|---|---|
| 4501 Cedros Avenue | Sherman Oaks | 1971 | 2 | 2 | 1,445 | 83,258 | $477 | $689,000 | 18 | 73 |
| 4260 Cedros | Los Angeles | 1985 | 2 | 3 | 1,263 | 6,753 | $713 | $899,999 | 64 | 71 |
| 4477 Woodman Avenue | Sherman Oaks | 1991 | 2 | 2 | 1,871 | 41,499 | $422 | $789,999 | 59 | 71 |
| 13331 Moorpark Street | Sherman Oaks | 1984 | 2 | 2 | 1,290 | 38,938 | $557 | $719,000 | 37 | 70 |
| 4915 Tyrone | Sherman Oaks | 1964 | 3 | 3 | 1,768 | 90,884 | $450 | $795,000 | 24 | 70 |
| Total: 5 · Average | 2.2 | 2.4 | 1,527.4 | 52,266.4 | $523.8 | $778,599.6 | 40.4 | |||
| Median | 1,445 | $789,999 | ||||||||
Closed Properties (5)
Closed Comparables
| Address | City | Year | Date | BD | BTH | SqFt | LotSz | LP | SP | SP/SqFt | SP/LP | DIM | Score |
|---|---|---|---|---|---|---|---|---|---|---|---|---|---|
| 14521 Benefit | Sherman Oaks | 1974 | 10/05/2026 | 3 | 2 | 1,744 | 33,355 | $779,000 | $730,000 | $419 | 0.94 | 53 | 81 |
| 14570 Benefit Street | Sherman Oaks | 1989 | 09/01/2026 | 2 | 3 | 1,960 | 13,612 | $875,000 | $875,000 | $446 | 1.00 | 32 | 78 |
| 14332 Dickens Street | Sherman Oaks | 1973 | 07/14/2026 | 3 | 3 | 1,631 | 29,750 | $869,000 | $870,000 | $533 | 1.00 | 48 | 76 |
| 14600 Dickens Street | Sherman Oaks | 1982 | 05/01/2026 | 2 | 3 | 1,731 | 22,004 | $799,000 | $750,000 | $433 | 0.94 | 239 | 74 |
| 4533 Vista Del Monte Avenue | Sherman Oaks | 2006 | 08/14/2026 | 3 | 3 | 1,800 | 19,515 | $880,000 | $865,000 | $481 | 0.98 | 37 | 74 |
| Total: 5 · Average | 2.6 | 2.8 | 1,773.2 | 23,647.2 | $818,000 | $818,000 | $462.4 | — | 81.8 | ||||
| Median | 1,744 | $865,000 | $865,000 | ||||||||||
Market Analysis
List vs Sale $/SqFt
Sale Price Trend
Days on Market
Sale vs List Price
This analysis was generated automatically from MLS data. For an in-depth, human-reviewed valuation, contact Joseph Sardella at josephsardella@gmail.com.