41680 Jamaica Sands Drive, Indio, CA 92203
41680 Jamaica Sands Drive, Indio, CA 92203
Property Description
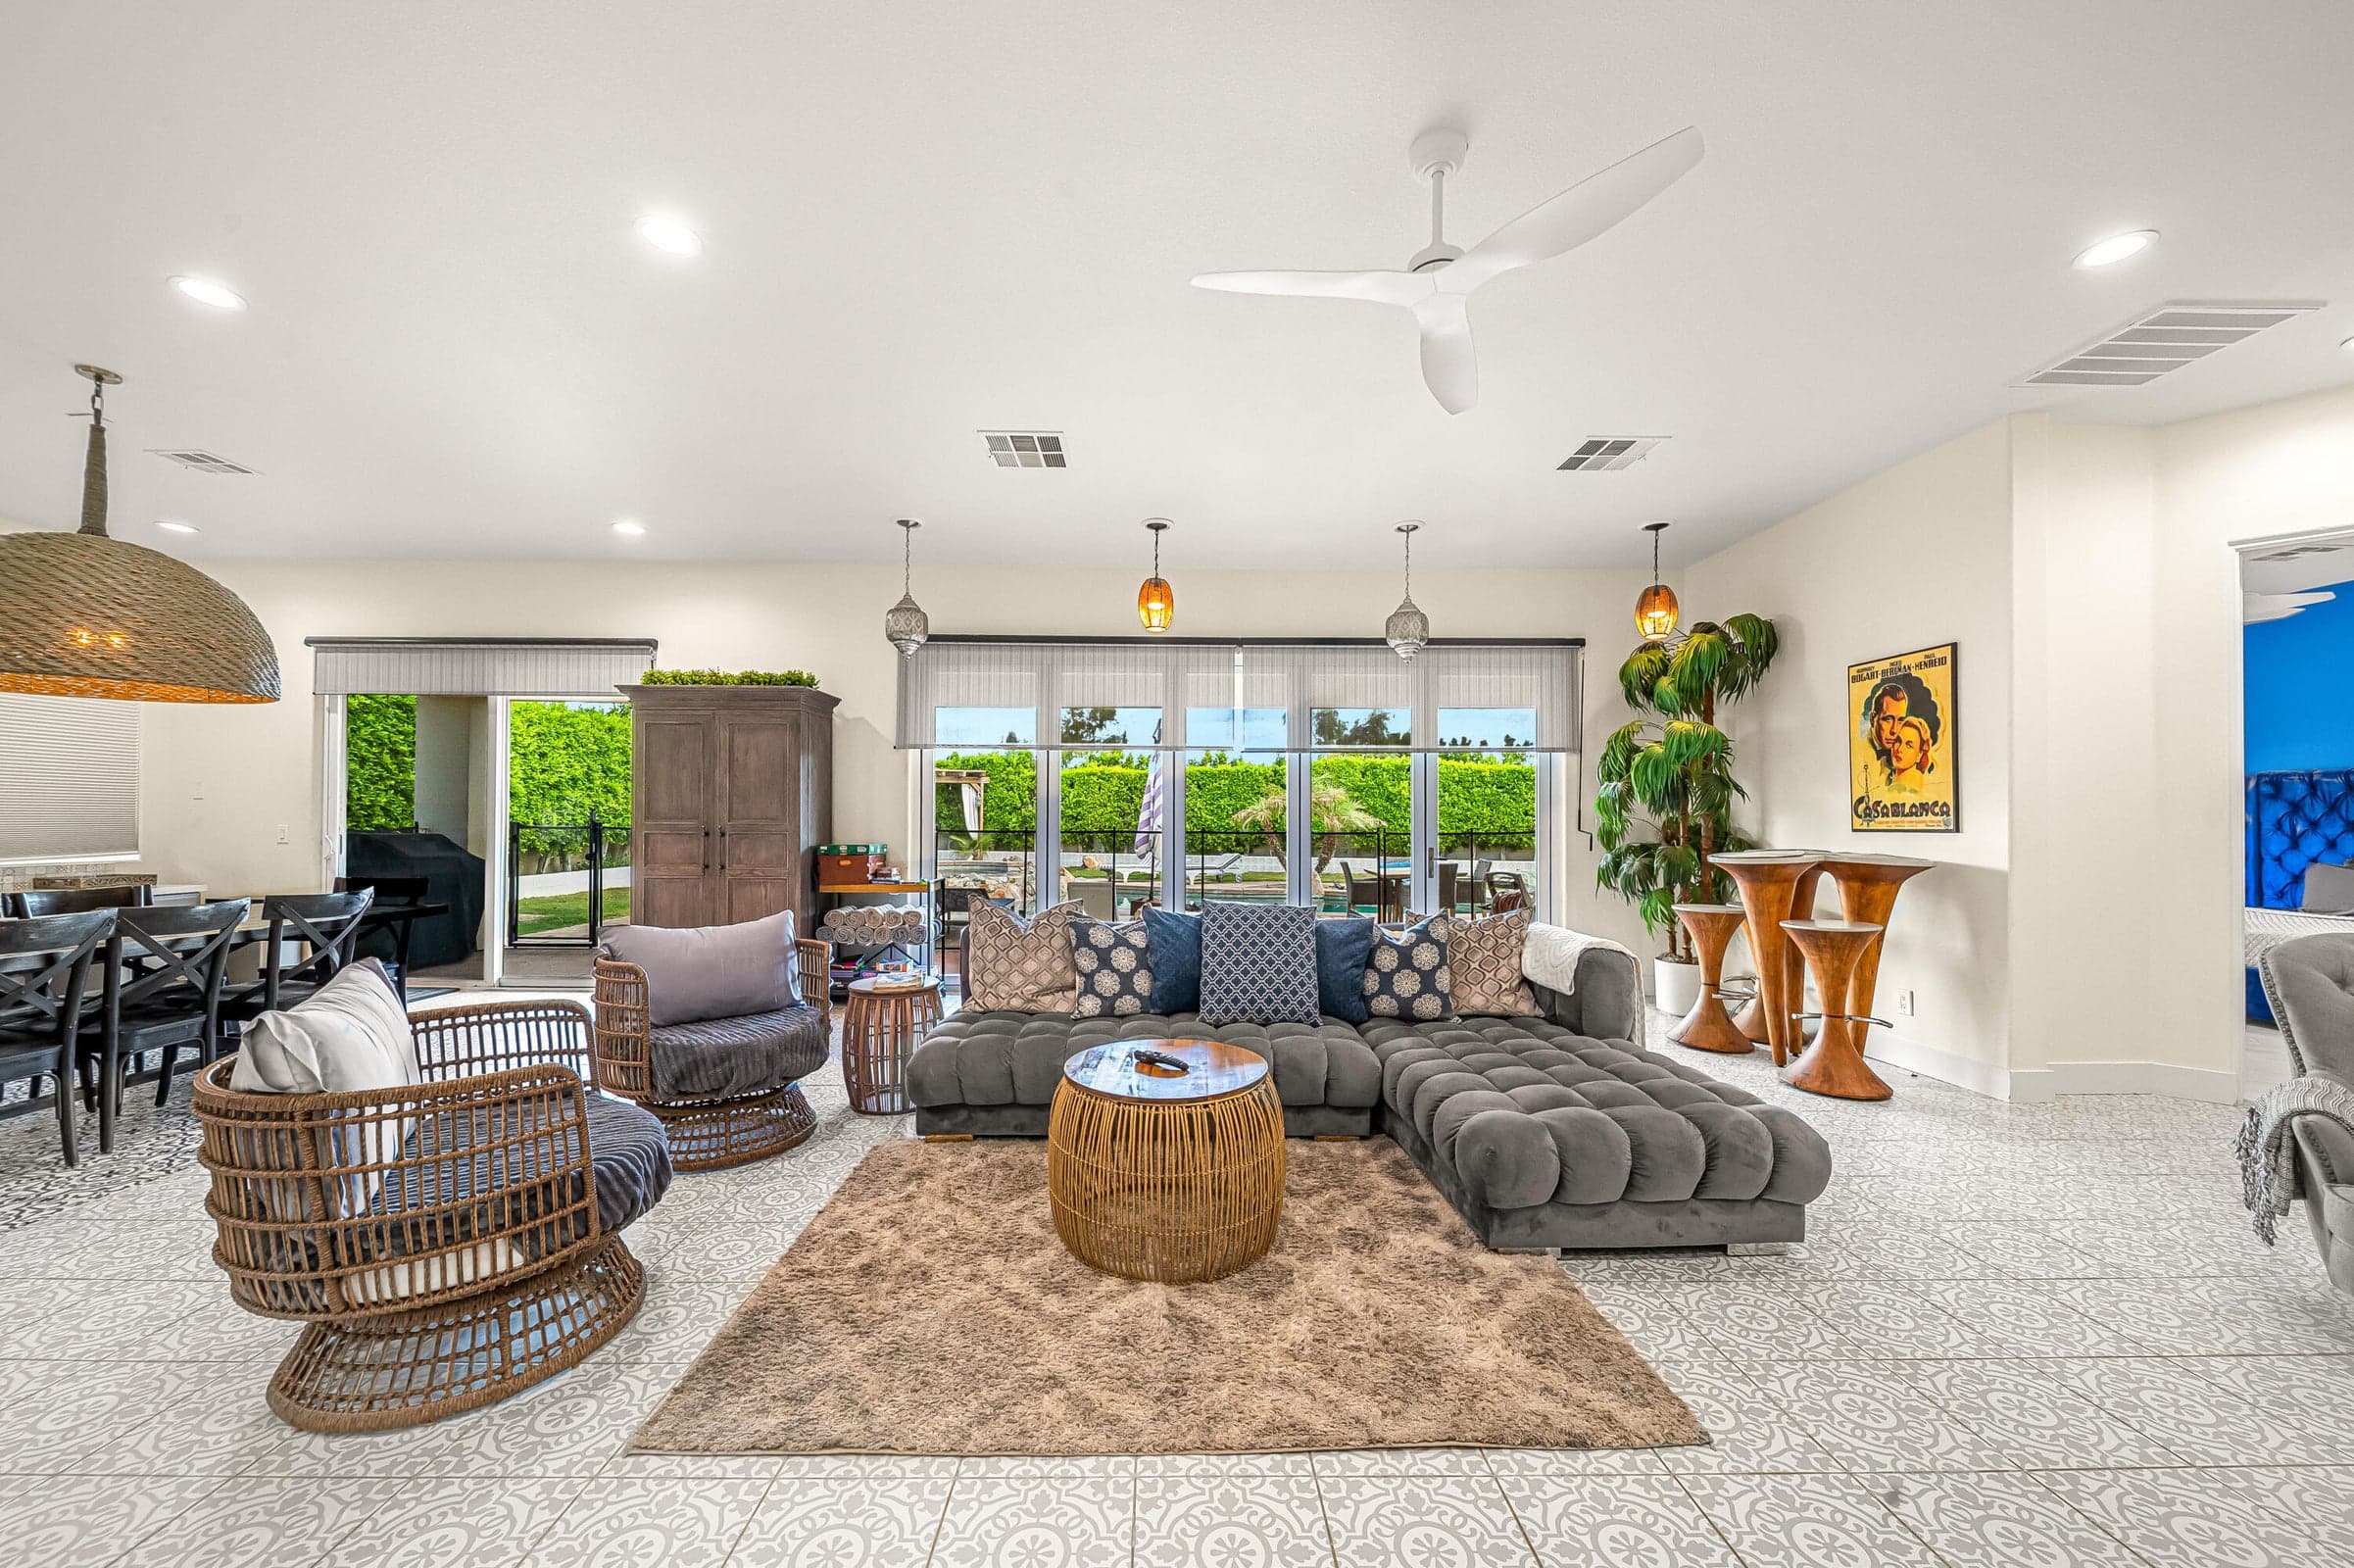
Turnkey income opportunity in the heart of Bermuda Dunes! This beautifully updated single-story pool home is currently operating as a vacation rental and is offered fully furnished, ready for its next owner to enjoy or to keep hosting guests from day one. Offering 3 bedrooms, 2 baths and approx. 1,947 sq ft on a generous lot of approx. 0.20 acre, with no HOA. Inside, 10-foot ceilings and an open great room create a bright, airy feel, and expansive pocket sliding glass doors open the entire back of the home to the patio for true indoor-outdoor desert living with mountain views. The custom kitchen features granite counters and generous cabinetry, perfect for entertaining. The private primary suite sits in its own wing with dual vanities, a walk-in shower and an oversized walk-in closet, while two additional bedrooms offer comfortable space for guests. The backyard is the star: a Pebble Tec saltwater pool and spa surrounded by pavers, a fire pit for cool desert evenings and a misting system for summer afternoons. Practical features include a laundry room with cabinetry and sink, a tandem garage with room for up to 3 cars, and a side yard with potential for trailer parking. Location is a true advantage: minutes to the Coachella and Stagecoach festival grounds, the Indian Wells Tennis Garden, Acrisure Arena, world-class golf, shopping, dining and quick I-10 access, with Palm Springs International Airport a short drive away. Desert Sands Unified School District. Whether you are looking for a proven short-term rental, a winter escape or a full-time residence, this home delivers. Investor package with rental history, bookings and operating expenses available upon request. Furniture and future bookings may be included per agreement. Short-term rental certificates in unincorporated Riverside County do not transfer; buyer to obtain their own and verify all rental income, permits and information.
Features & Amenities
Property Details
Mortgage Calculator
Current Rates
Comparative Market Analysis
Residential Tier · 5 active · 5 closed
Not Applicable · Indio · Single Family Residence
Listed 6.8% above the median closed sale of $725,000. Price per sqft ($387) is a 10% premium to closed comps ($351). Closed comps sold at 94% of list — buyers have negotiating leverage. Expect a longer timeline — comps averaged 143 days on market.
Price Position
Positioned above the market — commands a premium.
Active Properties (5)
Active Comparables
| Address | City | Year | BD | BTH | SqFt | LotSz | LP/SqFt | LP | DIM | Score |
|---|---|---|---|---|---|---|---|---|---|---|
| 42567 Bellagio Drive | Bermuda Dunes | 2002 | 3 | 3 | 2,203 | 8,276 | $390 | $859,000 | 31 | 88 |
| 79754 Viento Drive | La Quinta | 2004 | 4 | 2 | 2,172 | 9,583 | $366 | $795,000 | 7 | 82 |
| 41856 Volare Court | Bermuda Dunes | 2026 | 3 | 3 | 1,850 | 5,200 | $405 | $749,900 | 104 | 80 |
| 79847 Viento Drive | La Quinta | 2004 | 5 | 3 | 2,540 | 8,712 | $295 | $749,000 | 40 | 79 |
| 79261 Spalding Drive | Bermuda Dunes | 1980 | 4 | 2 | 1,623 | 8,276 | $431 | $700,000 | 81 | 77 |
| Total: 5 · Average | 3.8 | 2.6 | 2,077.6 | 8,009.4 | $377.4 | $770,580 | 52.6 | |||
| Median | 2,172 | $749,900 | ||||||||
Closed Properties (5)
Closed Comparables
| Address | City | Year | Date | BD | BTH | SqFt | LotSz | LP | SP | SP/SqFt | SP/LP | DIM | Score |
|---|---|---|---|---|---|---|---|---|---|---|---|---|---|
| 79371 Bowden Drive | Bermuda Dunes | 1980 | 11/21/2025 | 4 | 2 | 1,977 | 8,712 | $799,900 | $760,000 | $384 | 0.95 | 191 | 82 |
| 79540 Bermuda Dunes Drive | Bermuda Dunes | 1985 | 11/19/2025 | 3 | 3 | 2,258 | 12,197 | $795,000 | $725,000 | $321 | 0.91 | 110 | 76 |
| 79421 Avenue 42 | Bermuda Dunes | 2001 | 09/30/2026 | 2 | 3 | 1,819 | 12,632 | $699,000 | $715,000 | $393 | 1.02 | 181 | 76 |
| 79351 Bowden Drive | Bermuda Dunes | 1986 | 12/01/2025 | 3 | 2 | 1,761 | 8,276 | $699,999 | $720,000 | $409 | 1.03 | 49 | 74 |
| 79915 Bermuda Dunes Drive | Bermuda Dunes | 1992 | 04/15/2026 | 3 | 4 | 3,418 | 20,473 | $1.08M | $850,000 | $249 | 0.79 | 182 | 57 |
| Total: 5 · Average | 3.0 | 2.8 | 2,246.6 | 12,458 | $754,000 | $754,000 | $351.2 | — | 142.6 | ||||
| Median | 1,977 | $725,000 | $725,000 | ||||||||||
Market Analysis
List vs Sale $/SqFt
Sale Price Trend
Days on Market
Sale vs List Price
This analysis was generated automatically from MLS data. For an in-depth, human-reviewed valuation, contact Joseph Sardella at josephsardella@gmail.com.