415 Sefton Avenue South, G, Monterey Park, CA 91755
415 Sefton Avenue South, G, Monterey Park, CA 91755
Property Description
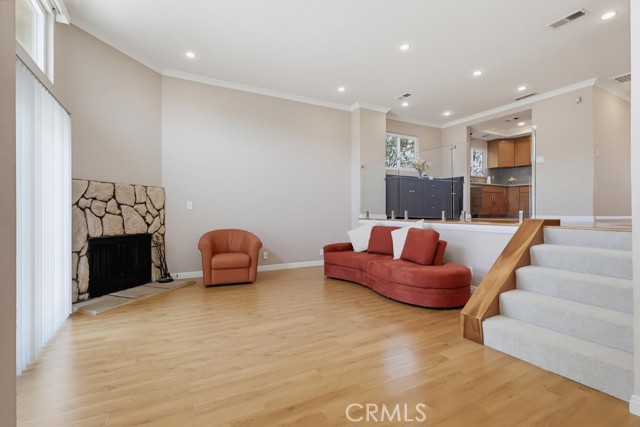
SELLER FINANCING AVAILABLE* Don't miss this Move-In condition 3-bedroom, 2-bath end-unit condo offering 1,436 sq. ft. of comfortable living space • Bright and airy living room with impressive high ceilings • Large, private patio—perfect for relaxing, entertaining, or enjoying the outdoors • Spacious master suite with a large walk-in closet and separate A/C, allowing you to set your own ideal temperature • Extra-deep garage with additional storage room and a workshop area • Low 300/month HOA fee includes water and insurance • Don’t miss this opportunity—come see this beautiful home before it’s too late! • VIRTUAL TOUR: Click the 360° symbol above to take a virtual tour! *Owner will carry 1st TD @ 5% (Subject to terms) with 30% down.
Features & Amenities
Property Details
Mortgage Calculator
Current Rates
Comparative Market Analysis
Affordable Tier · 5 active · 5 closed
Monterey Park · Condominium
Listed 5.9% above the median closed sale of $660,000.
Price Position
Positioned above the market — commands a premium.
Active Properties (5)
Active Comparables
| Address | City | Year | BD | BTH | SqFt | LotSz | LP/SqFt | LP | DIM | Score |
|---|---|---|---|---|---|---|---|---|---|---|
| 508 Orange Avenue | Monterey Park | 1978 | 3 | 3 | 1,275 | 31,712 | $494 | $630,000 | 52 | 89 |
| 506 Pomelo Avenue | Monterey Park | 1980 | 3 | 3 | 1,397 | 57,678 | $472 | $659,999 | 128 | 86 |
| 130 Moore | Monterey Park | 1984 | 3 | 3 | 1,586 | 20,298 | $504 | $799,000 | 148 | 82 |
| 305 Lincoln Avenue | Monterey Park | 1986 | 4 | 3 | 1,560 | 34,389 | $492 | $768,000 | 132 | 81 |
| 120 Moore | Monterey Park | 2003 | 2 | 2 | 1,459 | 20,226 | $478 | $697,000 | 104 | 79 |
| Total: 5 · Average | 3.0 | 2.8 | 1,455.4 | 32,860.6 | $488 | $710,799.8 | 112.8 | |||
| Median | 1,459 | $697,000 | ||||||||
Closed Properties (5)
Closed Comparables
| Address | City | Year | Date | BD | BTH | SqFt | LotSz | LP | SP | SP/SqFt | SP/LP | DIM | Score |
|---|---|---|---|---|---|---|---|---|---|---|---|---|---|
| 420 Alhambra Avenue | Monterey Park | 1984 | 08/12/2026 | 4 | 3 | 1,522 | 0 | $786,000 | $800,000 | $526 | 1.02 | 20 | 90 |
| 230 Nicholson Avenue | Monterey Park | 1979 | 01/06/2026 | 3 | 2 | 1,447 | 34,377 | $749,000 | $730,000 | $504 | 0.97 | 67 | 87 |
| 226 McPherrin Avenue | Monterey Park | 1979 | 09/28/2026 | 3 | 3 | 1,342 | 36,476 | $650,000 | $650,000 | $484 | 1.00 | 73 | 86 |
| 527 Orange | Monterey Park | 1981 | 04/23/2026 | 3 | 3 | 1,534 | 75,586 | $649,000 | $660,000 | $430 | 1.02 | 63 | 85 |
| 500 Garfield | Monterey Park | 1979 | 07/10/2026 | 3 | 3 | 1,251 | 14,886 | $638,000 | $600,000 | $480 | 0.94 | 77 | 84 |
| Total: 5 · Average | 3.2 | 2.8 | 1,419.2 | 40,331.25 | $688,000 | $688,000 | $484.8 | — | 60 | ||||
| Median | 1,447 | $660,000 | $660,000 | ||||||||||
Market Analysis
List vs Sale $/SqFt
Sale Price Trend
Days on Market
Sale vs List Price
This analysis was generated automatically from MLS data. For an in-depth, human-reviewed valuation, contact Joseph Sardella at josephsardella@gmail.com.