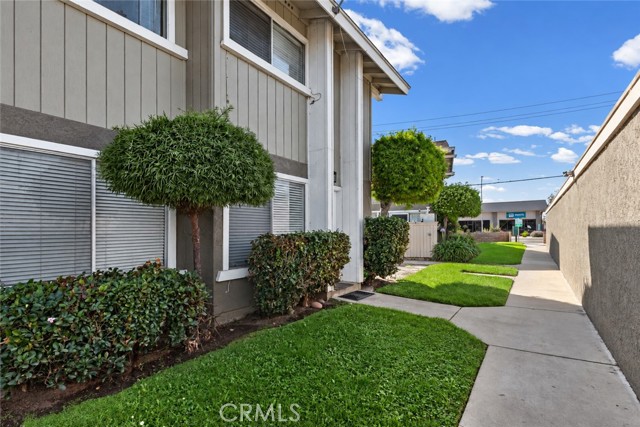
413 East Park, Santa Maria, CA 93454
413 East Park, Santa Maria, CA 93454
Property Description
Welcome to the Park Avenue Village Association at 413 E Park Ave #B1 This Home is perfect for the first time home buyer or investor. This property features a 2 bedroom and 2 baths with 1,088 sqft of living space. Living room, dining area, and kitchen give a perfect flow of space. 1/2 bathroom is located downstairs for guests. Upstairs have 2 bedrooms and a full bathroom. Detached 1 car garage. HOA covers Water and Trash as well as the maintenance of the area to keep it clean.
Features & Amenities
Property Details
Mortgage Calculator
Current Rates
Comparative Market Analysis
Affordable Tier · 5 active · 5 closed
Santa Maria · Condominium
Listed in line with the median closed sale of $347,500.
Price Position
Aligned with the market — fair pricing for the comps.
Active Properties (5)
Active Comparables
| Address | City | Year | BD | BTH | SqFt | LotSz | LP/SqFt | LP | DIM | Score |
|---|---|---|---|---|---|---|---|---|---|---|
| 2409 Country Lane | Santa Maria | 1984 | 2 | 2 | 1,082 | 961 | $350 | $379,000 | 12 | 80 |
| 311 Lolita | Santa Maria | 1984 | 2 | 2 | 1,026 | 471,754 | $360 | $369,750 | 34 | 79 |
| 1960 Mcclelland | Santa Maria | 1977 | 1 | 2 | 922 | 684 | $359 | $330,998 | 156 | 78 |
| 1321 Bradley | Santa Maria | 1978 | 3 | 2 | 1,360 | 1,120 | $261 | $354,950 | 89 | 75 |
| 2403 Country | Santa Maria | 1984 | 1 | 1 | 731 | 765 | $395 | $289,000 | 6 | 66 |
| Total: 5 · Average | 1.8 | 1.8 | 1,024.2 | 95,056.8 | $345 | $344,739.6 | 59.4 | |||
| Median | 1,026 | $354,950 | ||||||||
Closed Properties (5)
Closed Comparables
| Address | City | Year | Date | BD | BTH | SqFt | LotSz | LP | SP | SP/SqFt | SP/LP | DIM | Score |
|---|---|---|---|---|---|---|---|---|---|---|---|---|---|
| 3450 Santa Maria | Santa Maria | 1985 | 06/01/2026 | 2 | 2 | 882 | 898 | $347,500 | $347,500 | $394 | 1.00 | 92 | 84 |
| 1920 McClelland Street | Santa Maria | 1974 | 09/18/2026 | 2 | 2 | 1,242 | 873 | $350,000 | $350,000 | $282 | 1.00 | 56 | 84 |
| 1960 Mcclelland | Santa Maria | 1977 | 08/19/2026 | 2 | 2 | 1,027 | 1,056 | $359,900 | $366,000 | $356 | 1.02 | 106 | 83 |
| 321 Inger | Santa Maria | 1991 | 05/18/2026 | 2 | 2 | 953 | 923 | $330,000 | $314,500 | $330 | 0.95 | 24 | 79 |
| 321 E. Inger Drive | Santa Maria | 1991 | 05/26/2026 | 2 | 1 | 878 | 0 | $310,000 | $310,000 | $353 | 1.00 | 32 | 74 |
| Total: 5 · Average | 2.0 | 1.8 | 996.4 | 937.5 | $337,600 | $337,600 | $343 | — | 62 | ||||
| Median | 953 | $347,500 | $347,500 | ||||||||||
Market Analysis
List vs Sale $/SqFt
Sale Price Trend
Days on Market
Sale vs List Price
This analysis was generated automatically from MLS data. For an in-depth, human-reviewed valuation, contact Joseph Sardella at josephsardella@gmail.com.