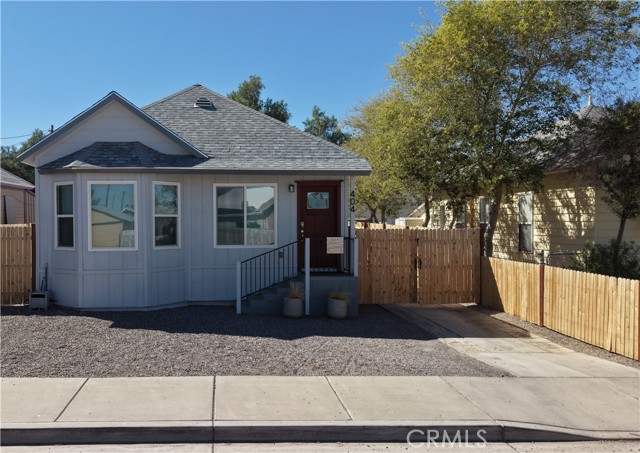
404 D Street, Needles, CA 92363
404 D Street, Needles, CA 92363
Property Description
Motivated! Move-In Ready! Modern Upgraded Home near Colorado River. Beautifully renovated and decorated conveniently located in the downtown of Needles close to schools, community college, shopping centers and public transportation. It is minutes away from Colorado River. This home features everything a family needs - spacious rooms, comfort and a big backyard.
Features & Amenities
Property Details
Mortgage Calculator
Current Rates
Comparative Market Analysis
Affordable Tier · 5 active · 3 closed
Needles · Single Family Residence
Listed in line with the median closed sale of $440,000. Price per sqft ($255) is a 12% premium to closed comps ($227).
Price Position
Aligned with the market — fair pricing for the comps.
Active Properties (5)
Active Comparables
| Address | City | Year | BD | BTH | SqFt | LotSz | LP/SqFt | LP | DIM | Score |
|---|---|---|---|---|---|---|---|---|---|---|
| 113 Aliso Street | Needles | 1948 | 3 | 2 | 1,210 | 6,250 | $312 | $377,000 | 24 | 76 |
| 1121 Marina Drive | Needles | 2005 | 3 | 2 | 1,392 | 4,320 | $315 | $438,000 | 7 | 75 |
| 1145 Marina Drive | Needles | 2005 | 3 | 2 | 1,620 | 3,960 | $246 | $399,000 | 108 | 74 |
| 1188 Beach Drive | Needles | 2002 | 3 | 2 | 1,523 | 4,230 | $282 | $429,000 | 257 | 72 |
| 1181 Marina | Needles | 2003 | 3 | 2 | 1,674 | 4,590 | $268 | $449,000 | 364 | 71 |
| Total: 5 · Average | 3.0 | 2.0 | 1,483.8 | 4,670 | $284.6 | $418,400 | 152 | |||
| Median | 1,523 | $429,000 | ||||||||
Closed Properties (3)
Closed Comparables
| Address | City | Year | Date | BD | BTH | SqFt | LotSz | LP | SP | SP/SqFt | SP/LP | DIM | Score |
|---|---|---|---|---|---|---|---|---|---|---|---|---|---|
| 404 D Street | Needles | 1925 | 11/07/2025 | 4 | 2 | 1,725 | 6,300 | $395,000 | $395,000 | $229 | 1.00 | 3 | 94 |
| 1224 Beach Drive | Needles | 2016 | 12/16/2025 | 3 | 3 | 1,584 | 4,325 | $449,000 | $440,000 | $278 | 0.98 | 97 | 68 |
| 204 Fairway Drive | Needles | 1986 | 10/07/2026 | 4 | 3 | 2,579 | 8,400 | $499,900 | $445,000 | $173 | 0.89 | 215 | 64 |
| Total: 3 · Average | 3.7 | 2.7 | 1,962.667 | 6,341.667 | $426,666.667 | $426,666.667 | $226.667 | — | 105 | ||||
| Median | 1,725 | $440,000 | $440,000 | ||||||||||
Market Analysis
List vs Sale $/SqFt
Sale Price Trend
Days on Market
Sale vs List Price
This analysis was generated automatically from MLS data. For an in-depth, human-reviewed valuation, contact Joseph Sardella at josephsardella@gmail.com.