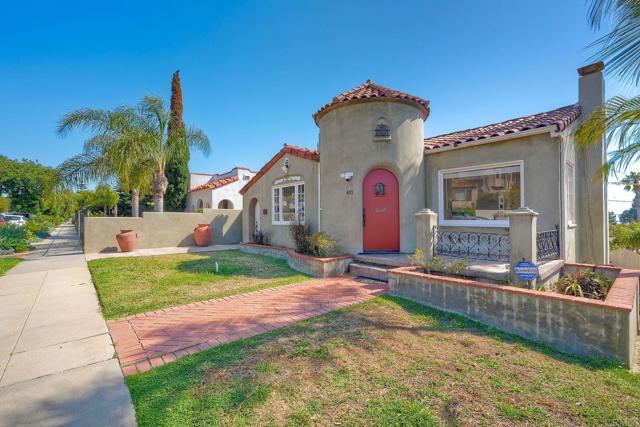
403 South Horne Street, Oceanside, CA 92054
403 South Horne Street, Oceanside, CA 92054
Property Description
Rare 1920s Spanish Style Beach Bungalow with Unobstructed Ocean Panoramas. Step back in time while enjoying the height of coastal luxury in this impeccably maintained 1920s beach bungalow. Perched at the highest point of a coveted corner lot, this home offers a rare blend of vintage character and modern move-in readiness. Experience true indoor-outdoor living with three expansive decks, each perfectly positioned to capture breathtaking, unobstructed views of the Pacific Ocean. Beyond the stunning vistas, the property is a lush private sanctuary featuring well-established landscaping and productive fruit trees. A detached two-car garage provides ample space for vehicles and beach gear. This is more than just a home; it’s a character-filled retreat where history meets the horizon.
Features & Amenities
Property Details
Mortgage Calculator
Current Rates
Comparative Market Analysis
Luxury Tier · 5 active · 5 closed
Oceanside · Single Family Residence
Listed 4.2% above the median closed sale of $1,680,000. Luxury tier — fewer comparable sales widen the confidence range.
Price Position
Aligned with the market — fair pricing for the comps.
Active Properties (5)
Active Comparables
| Address | City | Year | BD | BTH | SqFt | LotSz | LP/SqFt | LP | DIM | Score |
|---|---|---|---|---|---|---|---|---|---|---|
| 503 Nevada Street | Oceanside | 1950 | 3 | 2 | 1,128 | 5,268 | $1,498 | $1.69M | 106 | 76 |
| 2424 Papyrus Ct. | Oceanside | 2001 | 4 | 3 | 2,366 | 7,239 | $651 | $1.54M | 60 | 59 |
| 2658 Highland Drive | Carlsbad | 1931 | 3 | 2 | 1,634 | 8,500 | $1,040 | $1.70M | 25 | 56 |
| 1801 Ratcliff Road | Carlsbad | 1963 | 3 | 2 | 1,885 | 7,800 | $955 | $1.80M | 73 | 55 |
| 1390 Blue Port Way | Oceanside | 2024 | 4 | 3 | 2,264 | 871 | $706 | $1.60M | 30 | 54 |
| Total: 5 · Average | 3.4 | 2.4 | 1,855.4 | 5,935.6 | $970 | $1.67M | 58.8 | |||
| Median | 1,885 | $1.69M | ||||||||
Closed Properties (5)
Closed Comparables
| Address | City | Year | Date | BD | BTH | SqFt | LotSz | LP | SP | SP/SqFt | SP/LP | DIM | Score |
|---|---|---|---|---|---|---|---|---|---|---|---|---|---|
| 909 Leonard Avenue | Oceanside | 1939 | 04/24/2026 | 3 | 3 | 1,496 | 5,341 | $1.70M | $1.68M | $1,123 | 0.99 | 76 | 81 |
| 426 Nevada Street | Oceanside | 1948 | 04/30/2026 | 3 | 2 | 1,116 | 5,227 | $1.68M | $1.64M | $1,465 | 0.98 | 52 | 81 |
| 321 Freeman Street | Oceanside | 1926 | 07/10/2026 | 5 | 4 | 1,741 | 4,949 | $1.55M | $1.50M | $862 | 0.97 | 64 | 76 |
| 1008 Ditmar Street | Oceanside | 1926 | 05/28/2026 | 2 | 2 | 1,350 | 3,800 | $1.73M | $1.69M | $1,252 | 0.98 | 64 | 76 |
| 907 Tremont Street | Oceanside | 2015 | 06/25/2026 | 3 | 4 | 2,600 | 2,614 | $2.19M | $1.97M | $759 | 0.90 | 70 | 70 |
| Total: 5 · Average | 3.2 | 3.0 | 1,660.6 | 4,386.2 | $1.70M | $1.70M | $1,092.2 | — | 65.2 | ||||
| Median | 1,496 | $1.68M | $1.68M | ||||||||||
Market Analysis
List vs Sale $/SqFt
Sale Price Trend
Days on Market
Sale vs List Price
This analysis was generated automatically from MLS data. For an in-depth, human-reviewed valuation, contact Joseph Sardella at josephsardella@gmail.com.