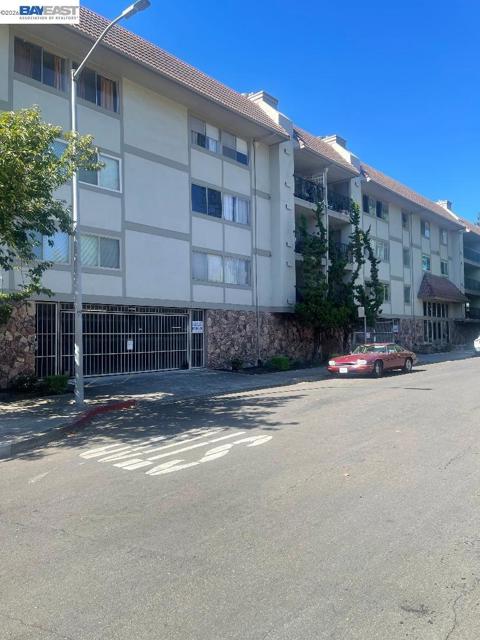
1 / 19
400 Davis, 301, San Leandro, CA 94577
$475K2bd · 2ba · 1,228 sqft
Lot 0 sqft•HOA $661/mo•Condominium•Active•94d on market•MLS# 01-41143521
400 Davis, 301, San Leandro, CA 94577
MLS# 01-41143521•Residential•Condominium
Active94 days on market
$475,000
2
Beds
2
Baths
1,228
Sq Ft
0
Lot Sq Ft
$661
HOA/mo
1982
Year Built
Property Description
Top floor unit with views of the hills. Prime downtown location!! Excellent condition!!
Features & Amenities
Property Details
Subdivision
Downtown
Land Type
Fee
Year Built
1982
Property Type
Residential
Property Subtype
Condominium
Parking Spaces
2
Garage Spaces
2
Heating
Forced Air
Cooling
None
Flooring
Wood
City
San Leandro
Zip Code
94577
County
Alameda
Mortgage Calculator
Current Rates
$
$
%
Monthly Payment
$2,401.86
Principal & Interest
Loan Amount
$380,000
Total Interest
$484,669
Total Payment Over 30 Years
$864,669
This calculator provides estimates only. Actual mortgage payments may include taxes, insurance, HOA fees, and PMI. Contact a lender for accurate quotes.
About Downtown
This property is located in Downtown, a community in San Leandro. Explore more listings in this neighborhood to compare options and pricing.
View Downtown ListingsComparative Market Analysis
Affordable Tier · 2 active · 5 closed
400 Davis, 301, San Leandro, CA 94577
Downtown · San Leandro · Condominium
$475K
Affordable TierBeds
2
Baths
2
Sqft
1,228
Lot
0 sqft
Year
1982
$/Sqft
$387
Pool: No✓
Garage: 2-car✓
Listed 3.1% below the median closed sale of $490,000. Closed comps sold at 105% of list — strong seller's market.
Price Position
Aligned with the market — fair pricing for the comps.
At market
Subject listed at $475K· $387/sqft
Total list price
Closed comps
vs closed median $490K
−$15K (−3.1%)
Active comps
vs active median $505K
−$30K (−5.9%)
Price per sqft
Closed compsinsufficient comp data
Active comps
vs active avg $/sqft $448
−$61 (−13.5%)
Active Properties (2)
Active Comparables
| Address | City | Year | BD | BTH | SqFt | LotSz | LP/SqFt | LP | DIM | Score |
|---|---|---|---|---|---|---|---|---|---|---|
| 385 CALIENTE CIR | San Leandro | 1980 | 2 | 2 | 1,060 | 266,413 | $476 | $505,000 | 44 | 66 |
| 650 Fargo Ave | San Leandro | 1965 | 3 | 3 | 1,180 | 184,837 | $419 | $495,000 | 16 | 54 |
| Total: 2 · Average | 2.5 | 2.5 | 1,120 | 225,625 | $447.5 | $500,000 | 30 | |||
| Median | 1,180 | $505,000 | ||||||||
Closed Properties (5)
Closed Comparables
| Address | City | Year | Date | BD | BTH | SqFt | LotSz | LP | SP | SP/SqFt | SP/LP | DIM | Score |
|---|---|---|---|---|---|---|---|---|---|---|---|---|---|
| 278 Estabrook St | San Leandro | 1993 | 09/11/2026 | 2 | 2 | 1,200 | 25,474 | $499,000 | $530,000 | $442 | 1.06 | 17 | 81 |
| 1132 carpentier st | San Leandro | 1983 | 12/30/2025 | 2 | 2 | 1,182 | 28,700 | $409,000 | $420,000 | $355 | 1.03 | 291 | 80 |
| 260 Estabrook St | San Leandro | 1993 | 08/13/2026 | 2 | 2 | 1,200 | 25,474 | $429,980 | $493,000 | $411 | 1.15 | 53 | 80 |
| 1563 Carpentier | San Leandro | 1986 | 08/04/2026 | 2 | 2 | 1,123 | 20,134 | $479,000 | $490,000 | $436 | 1.02 | 38 | 79 |
| 1550 Bancroft Ave | San Leandro | 1976 | 07/23/2026 | 2 | 2 | 1,404 | 44,007 | $418,888 | $419,000 | $298 | 1.00 | 85 | 78 |
| Total: 5 · Average | 2.0 | 2.0 | 1,221.8 | 28,757.8 | $470,400 | $470,400 | $388.4 | — | 96.8 | ||||
| Median | 1,200 | $490,000 | $490,000 | ||||||||||
Market Analysis
List vs Sale $/SqFt
Sale Price Trend
Days on Market
Sale vs List Price
AI-generated CMA
This analysis was generated automatically from MLS data. For an in-depth, human-reviewed valuation, contact Joseph Sardella at josephsardella@gmail.com.