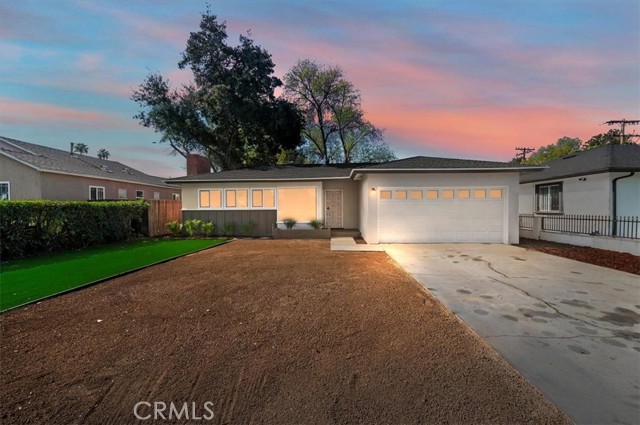
3986 Van Buren, Riverside, CA 92503
3986 Van Buren, Riverside, CA 92503
Property Description
****MOTIVATED SELLER- WILLING TO CONTRIBUTE BUYER CREDIT WITH RIGHT OFFER***Completely Upgraded Riverside Charmer with Bonus Jr. ADU! Features include new windows, beautiful new laminate floors throughout, updated A/C and electrical! Features a spacious galley kitchen with quartz counters, modern baths, and a cozy fireplace. Bonus Jr. ADU addition includes its own kitchenette and full bath—use as a primary suite or rent it out for extra income! Huge lot, 2-car garage, and turnkey finishes throughout. Don’t miss this flexible, income-generating opportunity!
Features & Amenities
Property Details
Mortgage Calculator
Current Rates
Comparative Market Analysis
Affordable Tier · 5 active · 5 closed
Riverside · Single Family Residence
Listed 9.8% below the median closed sale of $665,000. Closed comps sold at 102% of list — strong seller's market.
Price Position
Priced below the market — value advantage over the field.
Active Properties (5)
Active Comparables
| Address | City | Year | BD | BTH | SqFt | LotSz | LP/SqFt | LP | DIM | Score |
|---|---|---|---|---|---|---|---|---|---|---|
| 3555 Ross | Riverside | 1955 | 3 | 2 | 1,219 | 6,534 | $529 | $644,900 | 27 | 89 |
| 3665 Ross Street | Riverside | 1955 | 4 | 2 | 1,117 | 6,534 | $558 | $623,000 | 31 | 85 |
| 4153 Stotts | Riverside | 1965 | 4 | 3 | 1,488 | 8,276 | $383 | $569,900 | 4 | 84 |
| 9229 Delano | Riverside | 1977 | 3 | 2 | 1,104 | 6,534 | $562 | $619,999 | 12 | 83 |
| 9721 Indiana | Riverside | 1957 | 3 | 1 | 1,082 | 8,712 | $549 | $594,000 | 52 | 83 |
| Total: 5 · Average | 3.4 | 2.0 | 1,202 | 7,318 | $516.2 | $610,359.8 | 25.2 | |||
| Median | 1,117 | $619,999 | ||||||||
Closed Properties (5)
Closed Comparables
| Address | City | Year | Date | BD | BTH | SqFt | LotSz | LP | SP | SP/SqFt | SP/LP | DIM | Score |
|---|---|---|---|---|---|---|---|---|---|---|---|---|---|
| 4060 Harrison | Riverside | 1959 | 10/30/2026 | 3 | 2 | 1,058 | 7,841 | $579,777 | $575,000 | $543 | 0.99 | 140 | 91 |
| 4156 Acacia | Riverside | 1947 | 07/06/2026 | 4 | 2 | 1,500 | 8,276 | $625,000 | $665,000 | $443 | 1.06 | 77 | 88 |
| 9684 Sharon | Riverside | 1951 | 08/28/2026 | 4 | 2 | 1,636 | 10,890 | $680,000 | $680,000 | $416 | 1.00 | 106 | 87 |
| 4264 Harrison Street | Riverside | 1952 | 08/31/2026 | 3 | 2 | 1,191 | 68,825 | $639,900 | $639,900 | $537 | 1.00 | 41 | 87 |
| 4064 Acacia Street | Riverside | 1959 | 05/05/2026 | 4 | 2 | 1,564 | 8,712 | $659,000 | $675,000 | $432 | 1.02 | 59 | 81 |
| Total: 5 · Average | 3.6 | 2.0 | 1,389.8 | 20,908.8 | $646,980 | $646,980 | $474.2 | — | 84.6 | ||||
| Median | 1,500 | $665,000 | $665,000 | ||||||||||
Market Analysis
List vs Sale $/SqFt
Sale Price Trend
Days on Market
Sale vs List Price
This analysis was generated automatically from MLS data. For an in-depth, human-reviewed valuation, contact Joseph Sardella at josephsardella@gmail.com.