1 / 27
390 East Madison Avenue, H, El Cajon, CA 92020
$426K2bd · 2ba · 1,300 sqft
HOA $325/mo•Townhouse•Active•80d on market•MLS# 8N-2607696
390 East Madison Avenue, H, El Cajon, CA 92020
MLS# 8N-2607696•Residential•Townhouse
Active80 days on market
$426,000
2
Beds
2
Baths
1,300
Sq Ft
$325
HOA/mo
1982
Year Built
None
View
Property Description
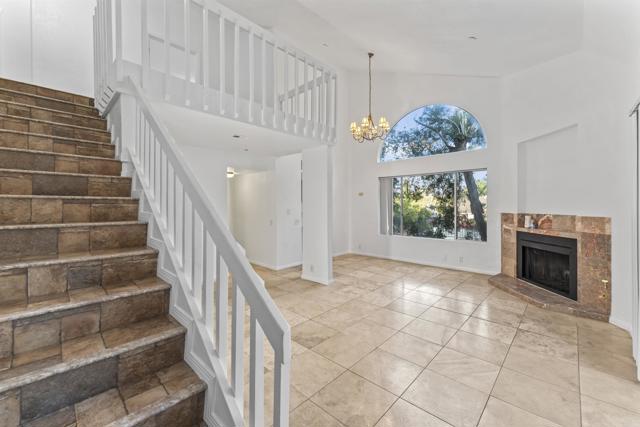
Beautiful spacious 2 bedroom/2 bathroom plus loft townhome! 3 balconies! Saoaring, vaulted ceilings! cozy fireplace! Gorgeous stone flooring. Inside Laundry closet! One car garage! Plus designated parking space. Convenient location to public tranist, stores, schools, universities, restaurants and more!
Features & Amenities
FeeBuilt 1982
Property Details
Land Type
Fee
Year Built
1982
Property Type
Residential
Property Subtype
Townhouse
Parking Spaces
2
Garage Spaces
1
Cooling
Central Air
View
None
Flooring
Stone
City
El Cajon
Zip Code
92020
County
San Diego
Mortgage Calculator
Current Rates
$
$
%
Monthly Payment
$2,154.09
Principal & Interest
Loan Amount
$340,800
Total Interest
$434,672
Total Payment Over 30 Years
$775,472
This calculator provides estimates only. Actual mortgage payments may include taxes, insurance, HOA fees, and PMI. Contact a lender for accurate quotes.
Comparative Market Analysis
Affordable Tier · 4 active · 5 closed
390 East Madison Avenue, H, El Cajon, CA 92020
El Cajon · Townhouse
$426K
Affordable TierBeds
2
Baths
2
Sqft
1,300
Lot
0 sqft
Year
1982
$/Sqft
$328
Pool: No✓
Spa: No✓
View: None✓
Garage: 1-car✓
Listed 3.2% below the median closed sale of $440,000. Price per sqft ($328) is a 19% discount to closed comps ($404).
Price Position
Aligned with the market — fair pricing for the comps.
At market
Subject listed at $426K· $328/sqft
Total list price
Closed comps
vs closed median $440K
−$14K (−3.2%)
Active comps
vs active median $450K
−$24K (−5.3%)
Price per sqft
Closed compsinsufficient comp data
Active comps
vs active avg $/sqft $484
−$156 (−32.3%)
Active Properties (4)
Active Comparables
| Address | City | Year | BD | BTH | SqFt | LotSz | LP/SqFt | LP | DIM | Score |
|---|---|---|---|---|---|---|---|---|---|---|
| 1321 Greenfield Drive | El Cajon | 2000 | 2 | 2 | 1,024 | 46,174 | $439 | $450,000 | 10 | 75 |
| 1218 Green Garden Dr | El Cajon | 1970 | 2 | 2 | 1,116 | 162,914 | $435 | $485,000 | 101 | 74 |
| 983 Amistad Place | El Cajon | 1973 | 2 | 1 | 945 | 0 | $421 | $398,000 | 110 | 66 |
| 5931 Howell Drive | La Mesa | 1974 | 1 | 1 | 576 | 2 | $642 | $369,999 | 80 | 55 |
| Total: 4 · Average | 1.8 | 1.5 | 915.25 | 69,696.667 | $484.25 | $425,749.75 | 75.25 | |||
| Median | 1,024 | $450,000 | ||||||||
Closed Properties (5)
Closed Comparables
| Address | City | Year | Date | BD | BTH | SqFt | LotSz | LP | SP | SP/SqFt | SP/LP | DIM | Score |
|---|---|---|---|---|---|---|---|---|---|---|---|---|---|
| 294 Chambers St | El Cajon | 1974 | 02/26/2026 | 2 | 2 | 1,116 | 0 | $420,000 | $420,000 | $376 | 1.00 | 196 | 82 |
| 1652 Summertime Dr | El Cajon | 1974 | 10/19/2026 | 3 | 2 | 1,136 | 209,959 | $449,900 | $449,900 | $396 | 1.00 | 44 | 79 |
| 1321 Greenfield Dr | El Cajon | 2000 | 10/14/2026 | 2 | 2 | 1,024 | 0 | $449,999 | $440,000 | $430 | 0.98 | 62 | 75 |
| 1719 Pepper Dr. | El Cajon | 1981 | 04/29/2026 | 2 | 2 | 953 | 0 | $389,000 | $365,000 | $383 | 0.94 | 61 | 68 |
| 995 Amistad Place | El Cajon | 1979 | 11/10/2025 | 2 | 2 | 1,024 | 162,742 | $445,000 | $445,000 | $435 | 1.00 | 35 | 68 |
| Total: 5 · Average | 2.2 | 2.0 | 1,050.6 | 186,350.5 | $423,980 | $423,980 | $404 | — | 79.6 | ||||
| Median | 1,024 | $440,000 | $440,000 | ||||||||||
Market Analysis
List vs Sale $/SqFt
Sale Price Trend
Days on Market
Sale vs List Price
AI-generated CMA
This analysis was generated automatically from MLS data. For an in-depth, human-reviewed valuation, contact Joseph Sardella at josephsardella@gmail.com.