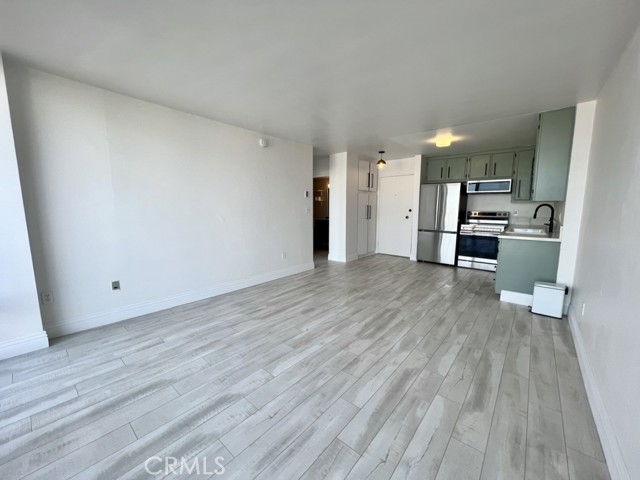
375 Atlantic, 501, Long Beach, CA 90802
375 Atlantic, 501, Long Beach, CA 90802
Property Description
Welcome to this updated one-bedroom, one-bath condo in the heart of downtown! Freshly painted with new flooring throughout, this property also features an updated bathroom and new kitchen appliances. The spacious primary bedroom offers plenty of closet space, with additional storage throughout the condo. Conveniently located near all that downtown has to offer, this is a great opportunity for a first-time buyer or investor. Don’t miss out on this move-in-ready unit!
Features & Amenities
Property Details
Mortgage Calculator
Current Rates
Comparative Market Analysis
Affordable Tier · 5 active · 5 closed
Long Beach · Condominium
Listed 4.9% above the median closed sale of $305,000. Expect a longer timeline — comps averaged 125 days on market.
Price Position
Aligned with the market — fair pricing for the comps.
Active Properties (5)
Active Comparables
| Address | City | Year | BD | BTH | SqFt | LotSz | LP/SqFt | LP | DIM | Score |
|---|---|---|---|---|---|---|---|---|---|---|
| 375 Atlantic | Long Beach | 1969 | 1 | 1 | 707 | 11,000 | $495 | $350,000 | 12 | 95 |
| 930 1st | Long Beach | 1955 | 1 | 1 | 591 | 11,139 | $591 | $349,000 | 12 | 91 |
| 801 1st Street | Long Beach | 1959 | 1 | 1 | 677 | 7,495 | $517 | $350,000 | 71 | 89 |
| 338 Elm Avenue | Long Beach | 1958 | 1 | 1 | 643 | 7,472 | $466 | $299,900 | 143 | 88 |
| 1015 Ocean Boulevard | Long Beach | 1957 | 1 | 1 | 620 | 8,235 | $494 | $306,000 | 115 | 87 |
| Total: 5 · Average | 1.0 | 1.0 | 647.6 | 9,068.2 | $512.6 | $330,980 | 70.6 | |||
| Median | 643 | $349,000 | ||||||||
Closed Properties (5)
Closed Comparables
| Address | City | Year | Date | BD | BTH | SqFt | LotSz | LP | SP | SP/SqFt | SP/LP | DIM | Score |
|---|---|---|---|---|---|---|---|---|---|---|---|---|---|
| 375 Atlantic | Long Beach | 1969 | 07/28/2026 | 1 | 1 | 707 | 11,000 | $299,988 | $275,000 | $389 | 0.92 | 131 | 94 |
| 250 Linden Avenue | Long Beach | 1964 | 04/15/2026 | 1 | 1 | 597 | 7,512 | $315,000 | $310,000 | $519 | 0.98 | 92 | 93 |
| 615 Broadway | Long Beach | 1972 | 05/19/2026 | 1 | 1 | 644 | 7,571 | $349,900 | $347,000 | $539 | 0.99 | 212 | 90 |
| 1187 3rd | Long Beach | 1969 | 09/09/2026 | 1 | 1 | 631 | 25,055 | $319,000 | $305,000 | $483 | 0.96 | 124 | 88 |
| 819 4th | Long Beach | 1955 | 05/11/2026 | 1 | 1 | 468 | 14,927 | $305,000 | $300,000 | $641 | 0.98 | 67 | 86 |
| Total: 5 · Average | 1.0 | 1.0 | 609.4 | 13,213 | $307,400 | $307,400 | $514.2 | — | 125.2 | ||||
| Median | 631 | $305,000 | $305,000 | ||||||||||
Market Analysis
List vs Sale $/SqFt
Sale Price Trend
Days on Market
Sale vs List Price
This analysis was generated automatically from MLS data. For an in-depth, human-reviewed valuation, contact Joseph Sardella at josephsardella@gmail.com.