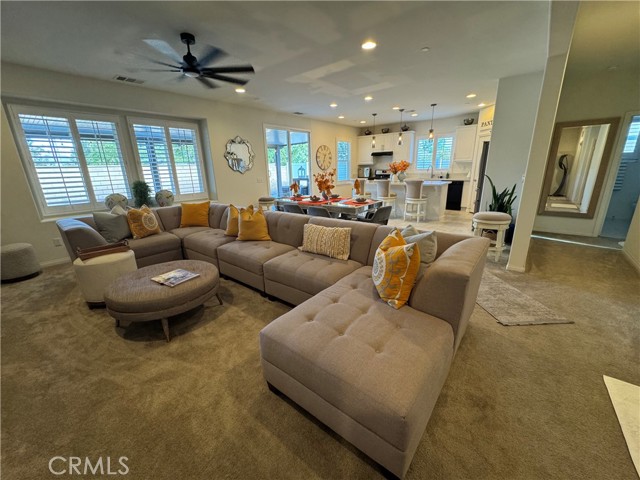
1 / 5
361 Pomegranate, San Jacinto, CA 92582
$550K3bd · 2ba · 1,698 sqft
Lot 9,583 sqft•HOA $63/mo•Single Family Residence•Active•24d on market•MLS# IV-26220461
361 Pomegranate, San Jacinto, CA 92582
MLS# IV-26220461•Residential•Single Family Residence
Active24 days on market
$549,797
3
Beds
2
Baths
1,698
Sq Ft
9,583
Lot Sq Ft
$63
HOA/mo
2016
Year Built
None
View
Property Description
MOVe in REady, Can't miss this one, shows like A MoDEl. coMe iNjoY the late nIgHTS in the great back YaRd
Features & Amenities
FeeBuilt 2016
Property Details
Land Type
Fee
Year Built
2016
Property Type
Residential
Property Subtype
Single Family Residence
Parking Spaces
2
Garage Spaces
2
Heating
Central
Cooling
Central Air
View
None
City
San Jacinto
Zip Code
92582
County
Riverside
Mortgage Calculator
Current Rates
$
$
%
Monthly Payment
$2,780.08
Principal & Interest
Loan Amount
$439,838
Total Interest
$560,989
Total Payment Over 30 Years
$1,000,827
This calculator provides estimates only. Actual mortgage payments may include taxes, insurance, HOA fees, and PMI. Contact a lender for accurate quotes.
Comparative Market Analysis
Residential Tier · 5 active · 5 closed
361 Pomegranate, San Jacinto, CA 92582
San Jacinto · Single Family Residence
$550K
Residential TierBeds
3
Baths
2
Sqft
1,698
Lot
9,583 sqft
Year
2016
$/Sqft
$324
Pool: No✓
View: None✓
Garage: 2-car✓
Listed 10.4% above the median closed sale of $498,000. Price per sqft ($324) is a 10% premium to closed comps ($294). Closed comps sold at 101% of list — strong seller's market.
Price Position
Positioned above the market — commands a premium.
Premium
Subject listed at $550K· $324/sqft
Total list price
Closed comps
vs closed median $498K
+$52K (+10.4%)
Active comps
vs active median $495K
+$55K (+11.1%)
Price per sqft
Closed compsinsufficient comp data
Active comps
vs active avg $/sqft $285
+$39 (+13.5%)
Active Properties (5)
Active Comparables
| Address | City | Year | BD | BTH | SqFt | LotSz | LP/SqFt | LP | DIM | Score |
|---|---|---|---|---|---|---|---|---|---|---|
| 3672 Old Oak | San Jacinto | 2015 | 3 | 2 | 1,859 | 8,712 | $280 | $520,000 | 26 | 94 |
| 729 Bailey Lane | San Jacinto | 2011 | 3 | 2 | 1,884 | 9,148 | $263 | $495,000 | 123 | 92 |
| 553 Chalakat Court | San Jacinto | 2022 | 4 | 2 | 1,860 | 10,454 | $277 | $515,000 | 45 | 90 |
| 577 Bailey Lane | San Jacinto | 2013 | 4 | 2 | 1,884 | 6,534 | $260 | $490,000 | 10 | 90 |
| 781 Amherst | San Jacinto | 2010 | 3 | 2 | 1,398 | 6,534 | $347 | $484,999 | 27 | 89 |
| Total: 5 · Average | 3.4 | 2.0 | 1,777 | 8,276.4 | $285.4 | $500,999.8 | 46.2 | |||
| Median | 1,860 | $495,000 | ||||||||
Closed Properties (5)
Closed Comparables
| Address | City | Year | Date | BD | BTH | SqFt | LotSz | LP | SP | SP/SqFt | SP/LP | DIM | Score |
|---|---|---|---|---|---|---|---|---|---|---|---|---|---|
| 695 Qeweewish Avenue | San Jacinto | 2021 | 06/24/2026 | 3 | 2 | 1,698 | 10,019 | $525,000 | $525,000 | $309 | 1.00 | 100 | 93 |
| 719 Amherst | San Jacinto | 2008 | 09/11/2026 | 3 | 2 | 1,657 | 6,534 | $489,900 | $498,000 | $301 | 1.02 | 107 | 91 |
| 852 Yukon | San Jacinto | 2012 | 07/24/2026 | 3 | 2 | 1,569 | 6,970 | $459,900 | $471,000 | $300 | 1.02 | 133 | 90 |
| 921 Yukon | San Jacinto | 2011 | 04/29/2026 | 4 | 2 | 1,884 | 9,583 | $495,000 | $495,000 | $263 | 1.00 | 114 | 88 |
| 528 Qeweewish | San Jacinto | 2021 | 06/29/2026 | 3 | 2 | 1,860 | 14,375 | $549,900 | $557,000 | $299 | 1.01 | 41 | 86 |
| Total: 5 · Average | 3.2 | 2.0 | 1,733.6 | 9,496.2 | $509,200 | $509,200 | $294.4 | — | 99 | ||||
| Median | 1,698 | $498,000 | $498,000 | ||||||||||
Market Analysis
List vs Sale $/SqFt
Sale Price Trend
Days on Market
Sale vs List Price
AI-generated CMA
This analysis was generated automatically from MLS data. For an in-depth, human-reviewed valuation, contact Joseph Sardella at josephsardella@gmail.com.