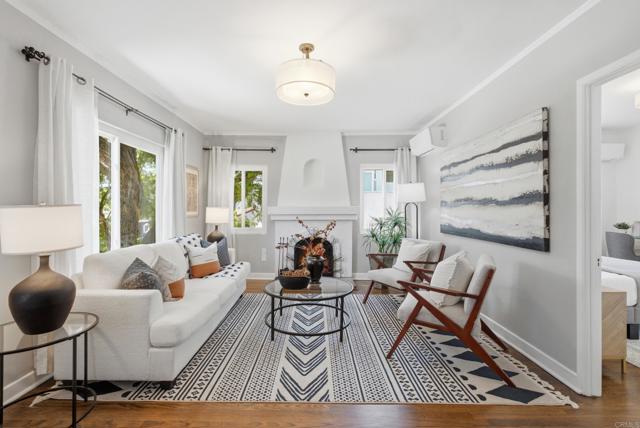
3606 FLORIDA ST, San Diego, CA 92104
3606 FLORIDA ST, San Diego, CA 92104
Property Description
AMAZING 2.5% ASSUMABLE LOAN. CALL for details! Rich in character & architectural charm, this North Park Spanish-style home showcases the craftsmanship & timeless appeal that define the neighborhood. Thoughtful updates complement its original character while preserving its distinctive charm. The 2BR/1BA main residence lives and feels like a single family home, all while a separate 1BR/1BA attached unit with its own entrance & patio area provides an ideal space for guests, extended family or rental income. Upgrades include 3 mini-split systems in the main house, newer TPO energy efficient roof, new vinyl fencing, 30 AMP EV car charger, new refrigerator & range in the main house, new paint throughout, & the studio has new flooring, freshly painted kitchen cabinets & a freshly tiled walk-in shower. Situated in San Diego’s most vibrant & walkable neighborhoods, homes like this rarely come up in this location.
Features & Amenities
Property Details
Mortgage Calculator
Current Rates
Comparative Market Analysis
Affordable Tier · 5 active · 5 closed
San Diego · Single Family Residence
Listed 3.1% above the median closed sale of $1,220,000.
Price Position
Aligned with the market — fair pricing for the comps.
Active Properties (5)
Active Comparables
| Address | City | Year | BD | BTH | SqFt | LotSz | LP/SqFt | LP | DIM | Score |
|---|---|---|---|---|---|---|---|---|---|---|
| 3927 Bancroft Street | San Diego | 1935 | 3 | 2 | 1,250 | 4,134 | $879 | $1.10M | 17 | 81 |
| 912 Bush Street | Mission Hills (San Diego) | 2020 | 2 | 2 | 1,153 | 4,185 | $1,213 | $1.40M | 25 | 71 |
| 2164 Boundary Street | San Diego | 1964 | 3 | 2 | 1,174 | 7,100 | $1,107 | $1.30M | 16 | 70 |
| 1594 Linwood Street | San Diego | 1920 | 3 | 2 | 1,484 | 5,001 | $940 | $1.40M | 94 | 68 |
| 2536 Montclair | San Diego | 1937 | 2 | 1 | 855 | 8,150 | $1,403 | $1.20M | 79 | 65 |
| Total: 5 · Average | 2.6 | 1.8 | 1,183.2 | 5,714 | $1,108.4 | $1.28M | 46.2 | |||
| Median | 1,174 | $1.30M | ||||||||
Closed Properties (5)
Closed Comparables
| Address | City | Year | Date | BD | BTH | SqFt | LotSz | LP | SP | SP/SqFt | SP/LP | DIM | Score |
|---|---|---|---|---|---|---|---|---|---|---|---|---|---|
| 2227 Wightman Street | San Diego | 1926 | 02/27/2026 | 3 | 2 | 878 | 3,920 | $1.10M | $1.15M | $1,310 | 1.04 | 35 | 86 |
| 3721 Indiana Street | San Diego | 1924 | 11/19/2025 | 3 | 1 | 1,144 | 4,497 | $1.20M | $1.22M | $1,066 | 1.02 | 27 | 86 |
| 3805 Louisiana Street | San Diego | 1920 | 12/31/2025 | 3 | 2 | 1,230 | 4,442 | $1.25M | $1.21M | $984 | 0.97 | 112 | 82 |
| 3594 31St Street | San Diego | 2022 | 09/29/2026 | 2 | 2 | 1,255 | 4,356 | $1.32M | $1.32M | $1,052 | 1.00 | 63 | 74 |
| 2807 Dale Street | San Diego | 1964 | 07/24/2026 | 3 | 3 | 1,440 | 7,405 | $1.38M | $1.33M | $924 | 0.97 | 49 | 66 |
| Total: 5 · Average | 2.8 | 2.0 | 1,189.4 | 4,924 | $1.25M | $1.25M | $1,067.2 | — | 57.2 | ||||
| Median | 1,230 | $1.22M | $1.22M | ||||||||||
Market Analysis
List vs Sale $/SqFt
Sale Price Trend
Days on Market
Sale vs List Price
This analysis was generated automatically from MLS data. For an in-depth, human-reviewed valuation, contact Joseph Sardella at josephsardella@gmail.com.