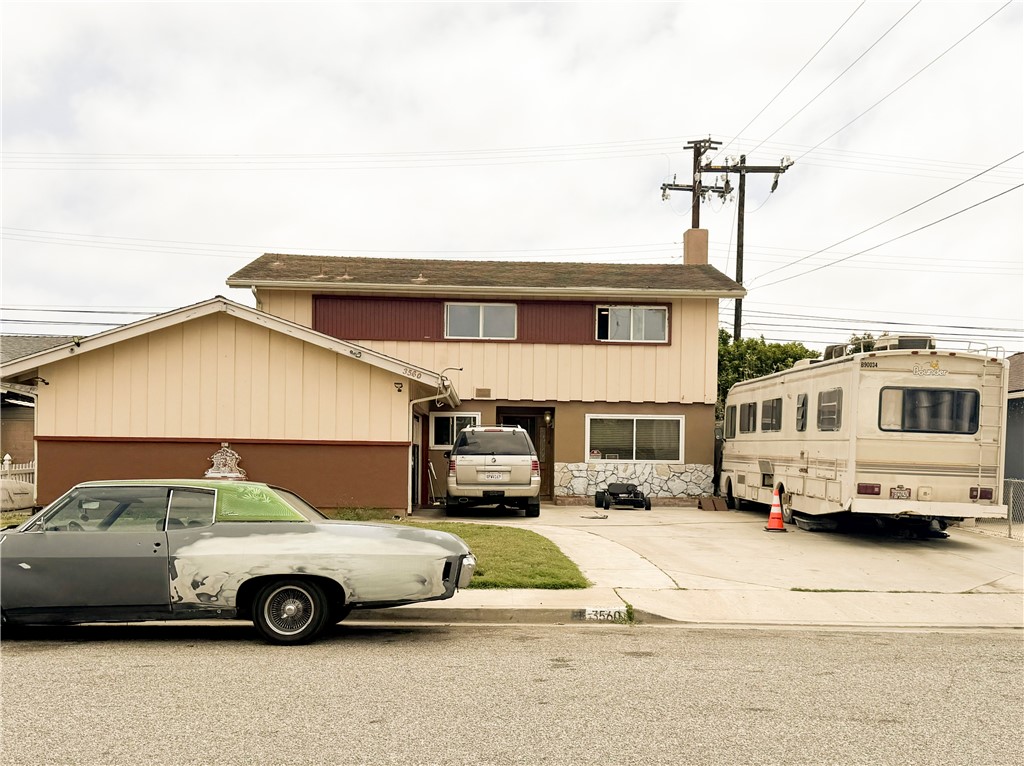
3560 San Simeon Avenue, Oxnard, CA 93033
3560 San Simeon Avenue, Oxnard, CA 93033
Property Description
Structurally a great home. Great curb appeal and great floor plan. Home needs some TLC. It is perfect for a large family. The home is ideally located near Oxnard College, Channel Islands High School and College Estates Park. Enjoy easy access to an abundance of shopping, dining and everyday conveniences. Just minutes away are Oxnard's spectacular Pacific Coast Beaches, including beautiful stretches of shoreline and the scenic Channel Island Harbor. Enjoy waterfront dining, boating, recreation and breathtaking views of the Channel Islands.
Features & Amenities
Property Details
Mortgage Calculator
Current Rates
Comparative Market Analysis
Residential Tier · 5 active · 5 closed
Oxnard · Single Family Residence
Listed in line with the median closed sale of $775,000. Price per sqft ($381) is a 12% discount to closed comps ($434). Closed comps sold at 102% of list — strong seller's market.
Price Position
Aligned with the market — fair pricing for the comps.
Active Properties (5)
Active Comparables
| Address | City | Year | BD | BTH | SqFt | LotSz | LP/SqFt | LP | DIM | Score |
|---|---|---|---|---|---|---|---|---|---|---|
| 541 La Canada Avenue | Oxnard | 1962 | 5 | 4 | 2,267 | 6,200 | $375 | $850,000 | 13 | 94 |
| 861 Morro Way | Oxnard | 1966 | 3 | 2 | 1,144 | 6,098 | $628 | $719,000 | 88 | 81 |
| 4400 Hamilton Avenue | Oxnard | 1964 | 3 | 2 | 1,381 | 5,662 | $528 | $729,000 | 44 | 79 |
| 4700 Frost | Oxnard | 1974 | 4 | 2 | 1,762 | 6,003 | $397 | $700,000 | 12 | 77 |
| 2914 Paula Street | Oxnard | 1957 | 3 | 2 | 1,170 | 6,969 | $615 | $719,000 | 40 | 69 |
| Total: 5 · Average | 3.6 | 2.4 | 1,544.8 | 6,186.4 | $508.6 | $743,400 | 39.4 | |||
| Median | 1,381 | $719,000 | ||||||||
Closed Properties (5)
Closed Comparables
| Address | City | Year | Date | BD | BTH | SqFt | LotSz | LP | SP | SP/SqFt | SP/LP | DIM | Score |
|---|---|---|---|---|---|---|---|---|---|---|---|---|---|
| 3450 Frankfort Court | Oxnard | 1969 | 09/09/2026 | 4 | 2 | 1,842 | 7,405 | $869,000 | $862,500 | $468 | 0.99 | 61 | 87 |
| 1220 Lindsay Place | Oxnard | 1978 | 11/21/2025 | 4 | 3 | 1,950 | 6,098 | $698,000 | $775,000 | $397 | 1.11 | 33 | 86 |
| 411 Yucca Street | Oxnard | 1962 | 10/23/2026 | 4 | 3 | 2,519 | 6,534 | $849,000 | $865,000 | $343 | 1.02 | 41 | 85 |
| 3450 Frankfort Court | Oxnard | 1969 | 05/04/2026 | 4 | 2 | 1,842 | 7,405 | $699,900 | $690,000 | $375 | 0.99 | 16 | 85 |
| 3620 San Simeon Avenue | Oxnard | 1966 | 07/16/2026 | 4 | 2 | 1,276 | 6,098 | $749,000 | $750,100 | $588 | 1.00 | 34 | 84 |
| Total: 5 · Average | 4.0 | 2.4 | 1,885.8 | 6,708 | $788,520 | $788,520 | $434.2 | — | 37 | ||||
| Median | 1,842 | $775,000 | $775,000 | ||||||||||
Market Analysis
List vs Sale $/SqFt
Sale Price Trend
Days on Market
Sale vs List Price
This analysis was generated automatically from MLS data. For an in-depth, human-reviewed valuation, contact Joseph Sardella at josephsardella@gmail.com.