1 / 2
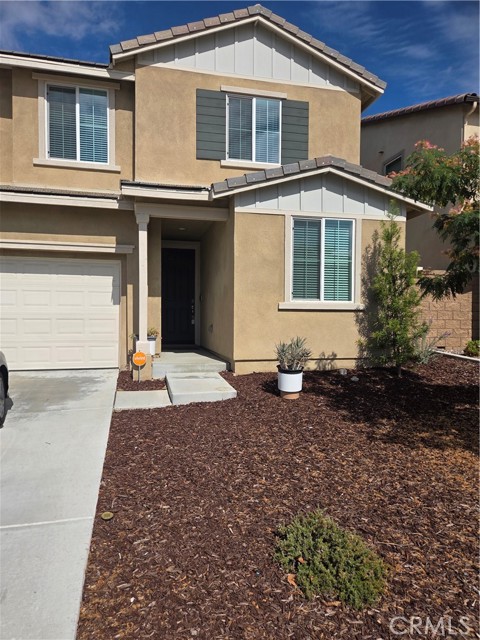
35564 Roxy Drive, Beaumont, CA 92223
$545K5bd · 3ba · 2,371 sqft
Lot 6,800 sqft•HOA $155/mo•Single Family Residence•Active•43d on market•MLS# IV-26206658
35564 Roxy Drive, Beaumont, CA 92223
MLS# IV-26206658•Residential•Single Family Residence
Active43 days on market
$545,000
5
Beds
3
Baths
2,371
Sq Ft
6,800
Lot Sq Ft
$155
HOA/mo
2022
Year Built
None
View
Property Description
***SHORT SALE**** single-family residence built in 2022, featuring 5 beds and 3 baths on a 6,800 sq ft lot across two stories.
Features & Amenities
FeeBuilt 2022
Property Details
Land Type
Fee
Year Built
2022
Property Type
Residential
Property Subtype
Single Family Residence
Parking Spaces
2
Garage Spaces
2
Heating
Central
Cooling
Central Air
View
None
City
Beaumont
Zip Code
92223
County
Riverside
Mortgage Calculator
Current Rates
$
$
%
Monthly Payment
$2,755.82
Principal & Interest
Loan Amount
$436,000
Total Interest
$556,094
Total Payment Over 30 Years
$992,094
This calculator provides estimates only. Actual mortgage payments may include taxes, insurance, HOA fees, and PMI. Contact a lender for accurate quotes.
Comparative Market Analysis
Residential Tier · 5 active · 5 closed
35564 Roxy Drive, Beaumont, CA 92223
Beaumont · Single Family Residence
$545K
Residential TierBeds
5
Baths
3
Sqft
2,371
Lot
6,800 sqft
Year
2022
$/Sqft
$230
Pool: No✓
View: None✓
Garage: 2-car✓
Listed 9.2% below the median closed sale of $599,900. Price per sqft ($230) is a 11% discount to closed comps ($258). Closed comps sold at 100% of list — strong seller's market. Expect a longer timeline — comps averaged 136 days on market.
Price Position
Priced below the market — value advantage over the field.
Price advantage
Subject listed at $545K· $230/sqft
Total list price
Closed comps
vs closed median $600K
−$55K (−9.2%)
Active comps
vs active median $585K
−$40K (−6.8%)
Price per sqft
Closed compsinsufficient comp data
Active comps
vs active avg $/sqft $250
−$20 (−7.9%)
Active Properties (5)
Active Comparables
| Address | City | Year | BD | BTH | SqFt | LotSz | LP/SqFt | LP | DIM | Score |
|---|---|---|---|---|---|---|---|---|---|---|
| 11481 Kyler Drive | Beaumont | 2023 | 5 | 3 | 2,371 | 5,859 | $253 | $599,888 | 23 | 98 |
| 11633 Ford Street | Beaumont | 2023 | 5 | 3 | 2,311 | 10,018 | $260 | $599,900 | 89 | 92 |
| 35357 Hutchison Place | Beaumont | 2023 | 4 | 3 | 2,456 | 4,791 | $230 | $565,000 | 3 | 91 |
| 11536 Jack St | Beaumont | 2024 | 4 | 3 | 2,227 | 4,408 | $263 | $585,000 | 51 | 90 |
| 11554 Hanna | Beaumont | 2022 | 4 | 3 | 2,227 | 4,038 | $242 | $540,000 | 81 | 90 |
| Total: 5 · Average | 4.4 | 3.0 | 2,318.4 | 5,822.8 | $249.6 | $577,957.6 | 49.4 | |||
| Median | 2,311 | $585,000 | ||||||||
Closed Properties (5)
Closed Comparables
| Address | City | Year | Date | BD | BTH | SqFt | LotSz | LP | SP | SP/SqFt | SP/LP | DIM | Score |
|---|---|---|---|---|---|---|---|---|---|---|---|---|---|
| 35342 Josh Drive | Beaumont | 2021 | 08/21/2026 | 4 | 3 | 2,227 | 6,543 | $559,999 | $559,999 | $251 | 1.00 | 123 | 94 |
| 35631 Alexis | Beaumont | 2023 | 05/15/2026 | 4 | 3 | 2,371 | 6,072 | $599,900 | $599,900 | $253 | 1.00 | 185 | 94 |
| 35320 Aubrey | Beaumont | 2023 | 07/01/2026 | 4 | 3 | 2,362 | 5,754 | $599,999 | $610,000 | $258 | 1.02 | 110 | 92 |
| 11619 Ford Street | Beaumont | 2024 | 11/26/2025 | 5 | 3 | 2,311 | 7,182 | $599,999 | $599,999 | $260 | 1.00 | 176 | 92 |
| 35585 Roxy | Beaumont | 2021 | 10/09/2026 | 4 | 3 | 2,023 | 4,953 | $549,900 | $545,000 | $269 | 0.99 | 87 | 91 |
| Total: 5 · Average | 4.2 | 3.0 | 2,258.8 | 6,100.8 | $582,979.6 | $582,979.6 | $258.2 | — | 136.2 | ||||
| Median | 2,311 | $599,900 | $599,900 | ||||||||||
Market Analysis
List vs Sale $/SqFt
Sale Price Trend
Days on Market
Sale vs List Price
AI-generated CMA
This analysis was generated automatically from MLS data. For an in-depth, human-reviewed valuation, contact Joseph Sardella at josephsardella@gmail.com.