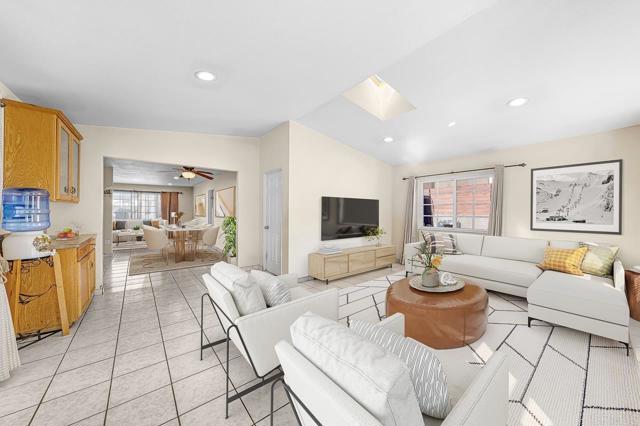
3522 Newberry Street, National City, CA 91950
3522 Newberry Street, National City, CA 91950
Property Description
5 BEDROOMS. 5,800 SQ FT LOT. SWEAT EQUITY OPPORTUNITY. Rare 5 bedroom, 1.5 bathroom single-family home in National City’s Sweetwater Heights neighborhood, where Bonita, Paradise Hills, and National City meet. Built in 1962 with approximately 1,660 square feet of living space, the layout works for a large or multigenerational household, a home office setup, or a buyer who needs room to grow. The home is ready for its next owner to put their own stamp on it. Update the finishes, design the kitchen you want, and build equity along the way. Newberry Street is your chance to build instant sweat equity in one of National City's established neighborhoods. The 5,800 square foot lot gives you a large yard with room to entertain, garden, play, or plan your next project. Quick freeway access makes commuting anywhere in San Diego County easy, with shopping, dining, and parks close by.
Features & Amenities
Property Details
Mortgage Calculator
Current Rates
Comparative Market Analysis
Residential Tier · 5 active · 5 closed
National City · Single Family Residence
Listed in line with the median closed sale of $750,000. Closed comps sold at 101% of list — strong seller's market.
Price Position
Aligned with the market — fair pricing for the comps.
Active Properties (5)
Active Comparables
| Address | City | Year | BD | BTH | SqFt | LotSz | LP/SqFt | LP | DIM | Score |
|---|---|---|---|---|---|---|---|---|---|---|
| 5949 Tonawanda Drive | San Diego | 1979 | 3 | 2 | 1,568 | 5,486 | $478 | $750,000 | 73 | 86 |
| 6187 Parkside Avenue | San Diego | 1972 | 4 | 2 | 1,844 | 4,800 | $466 | $859,000 | 17 | 85 |
| 2573 Calle Aguadulce | San Diego | 1957 | 3 | 2 | 1,353 | 6,098 | $591 | $799,900 | 46 | 80 |
| 2595 Calle Tres Lomas | San Diego | 1959 | 3 | 2 | 1,233 | 6,500 | $606 | $747,000 | 60 | 77 |
| 2959 Ridgeway Drive | National City | 1931 | 3 | 2 | 1,300 | 7,941 | $576 | $749,000 | 4 | 77 |
| Total: 5 · Average | 3.2 | 2.0 | 1,459.6 | 6,165 | $543.4 | $780,980 | 40 | |||
| Median | 1,353 | $750,000 | ||||||||
Closed Properties (5)
Closed Comparables
| Address | City | Year | Date | BD | BTH | SqFt | LotSz | LP | SP | SP/SqFt | SP/LP | DIM | Score |
|---|---|---|---|---|---|---|---|---|---|---|---|---|---|
| 3044 Fleming Drive | San Diego | 1972 | 12/09/2025 | 4 | 2 | 1,844 | 4,400 | $769,000 | $800,000 | $434 | 1.04 | 40 | 81 |
| 3047 Fleming Drive | San Diego | 1973 | 05/15/2026 | 4 | 3 | 1,844 | 4,356 | $839,000 | $839,000 | $455 | 1.00 | 90 | 80 |
| 2862 Callejon | San Diego | 1960 | 02/09/2026 | 3 | 3 | 1,480 | 8,200 | $725,000 | $750,000 | $507 | 1.03 | 33 | 77 |
| 5762 Calle Sal Si Puedes | San Diego | 1960 | 11/25/2025 | 3 | 2 | 1,200 | 10,400 | $740,000 | $740,000 | $617 | 1.00 | 68 | 72 |
| 3416 Paseo de Fuentes | National City | 2006 | 12/12/2025 | 3 | 3 | 1,463 | 32,600 | $740,000 | $732,500 | $501 | 0.99 | 57 | 65 |
| Total: 5 · Average | 3.4 | 2.6 | 1,566.2 | 11,991.2 | $772,300 | $772,300 | $502.8 | — | 57.6 | ||||
| Median | 1,480 | $750,000 | $750,000 | ||||||||||
Market Analysis
List vs Sale $/SqFt
Sale Price Trend
Days on Market
Sale vs List Price
This analysis was generated automatically from MLS data. For an in-depth, human-reviewed valuation, contact Joseph Sardella at josephsardella@gmail.com.