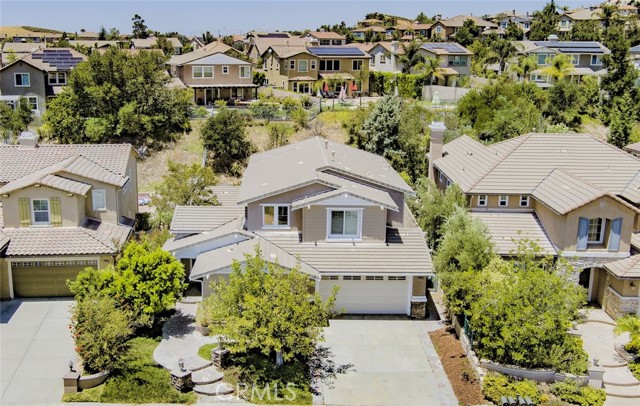
3465 Sweetgrass, Simi Valley, CA 93065
3465 Sweetgrass, Simi Valley, CA 93065
Property Description
MAJOR REDUCTION, LOWEST IN THE COMMUNITY. Discover the charm of this exquisite 5 bedrooms and 3.5 baths and a flexible bonus a den or home office downstairs, where comfort meets tranquility. Beautiful traditional home. Spacious floor plan with tile, carpets and lots of natural light. Great kitchen with granite counter, and stainless steel appliances. Large open living room with bay window and plantation shutters. Family room with fireplace. Luxury spacious master suite with double door entry, and walk in closet. Master bath with double vanity and oversized shower. Private and walled rear yard landscaped with lush greenery, trees, and hillside. The price is lowest in the community and should be sell very quickly!
Features & Amenities
Property Details
Mortgage Calculator
Current Rates
Comparative Market Analysis
Luxury Tier · 5 active · 5 closed
Simi Valley · Single Family Residence
Listed 6.9% above the median closed sale of $1,075,000. Price per sqft ($364) is a 16% discount to closed comps ($435). Luxury tier — fewer comparable sales widen the confidence range.
Price Position
Positioned above the market — commands a premium.
Active Properties (5)
Active Comparables
| Address | City | Year | BD | BTH | SqFt | LotSz | LP/SqFt | LP | DIM | Score |
|---|---|---|---|---|---|---|---|---|---|---|
| 2642 Blue Ridge Circle | Simi Valley | 1963 | 3 | 4 | 2,607 | 9,583 | $432 | $1.13M | 49 | 78 |
| 2055 Stoneman Street | Simi Valley | 1976 | 4 | 3 | 2,028 | 10,018 | $493 | $999,000 | 2 | 75 |
| 2313 Rynerson Court | Simi Valley | 1972 | 5 | 3 | 2,696 | 6,969 | $427 | $1.15M | 170 | 74 |
| 1829 Swan Falls | Simi Valley | 2005 | 3 | 3 | 2,347 | 5,227 | $458 | $1.07M | 75 | 73 |
| 2161 Stoneman Street | Simi Valley | 1976 | 3 | 3 | 2,332 | 49,222 | $441 | $1.03M | 74 | 57 |
| Total: 5 · Average | 3.6 | 3.2 | 2,402 | 16,203.8 | $450.2 | $1.08M | 74 | |||
| Median | 2,347 | $1.07M | ||||||||
Closed Properties (5)
Closed Comparables
| Address | City | Year | Date | BD | BTH | SqFt | LotSz | LP | SP | SP/SqFt | SP/LP | DIM | Score |
|---|---|---|---|---|---|---|---|---|---|---|---|---|---|
| 3657 Legends Drive | Simi Valley | 2006 | 09/15/2026 | 5 | 4 | 3,909 | 10,018 | $1.35M | $1.31M | $335 | 0.97 | 69 | 88 |
| 3607 Cascara Court | Simi Valley | 2006 | 11/17/2025 | 4 | 3 | 2,034 | 8,712 | $1.02M | $1.00M | $492 | 0.98 | 177 | 80 |
| 2057 Woodglen Street | Simi Valley | 1976 | 08/29/2026 | 7 | 5 | 3,267 | 12,196 | $1.25M | $1.25M | $382 | 1.00 | 53 | 76 |
| 1865 Swan Falls Street | Simi Valley | 2005 | 11/18/2025 | 4 | 3 | 2,347 | 5,227 | $1.10M | $1.07M | $458 | 0.98 | 40 | 72 |
| 2896 Wanda Avenue | Simi Valley | 1979 | 10/30/2026 | 4 | 2 | 1,988 | 10,454 | $999,999 | $1.01M | $508 | 1.01 | 53 | 69 |
| Total: 5 · Average | 4.8 | 3.4 | 2,709 | 9,321.4 | $1.13M | $1.13M | $435 | — | 78.4 | ||||
| Median | 2,347 | $1.07M | $1.07M | ||||||||||
Market Analysis
List vs Sale $/SqFt
Sale Price Trend
Days on Market
Sale vs List Price
This analysis was generated automatically from MLS data. For an in-depth, human-reviewed valuation, contact Joseph Sardella at josephsardella@gmail.com.