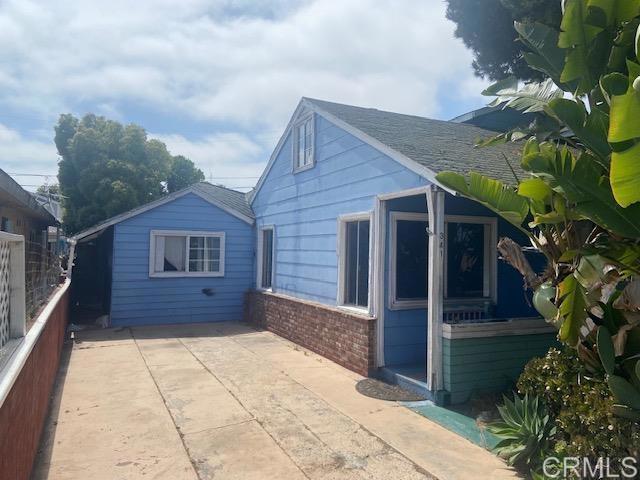
341 Brooks Street, Oceanside, CA 92054
341 Brooks Street, Oceanside, CA 92054
Property Description
INVESTOR / CONTRACTOR SPECIAL — CASH ONLY! Major fixer opportunity west of I-5! One building with three homes/units on one lot, zoned R-3. Property is being sold as-is and requires extensive renovation. Front home: 2 bedrooms+ optional room, 1 bathroom, approximately 786 sq. ft., with a spacious private side yard and front yard. Middle home: 1-bedroom, 1-bathroom addition/conversion/Jr. ADU, approximately 431 sq. ft. Rear home: 1 bedroom, 1 bathroom, approximately 592 sq. ft., with its own separate yard area. Seller reports plans have been submitted and associated plan/permit fees paid, with plans and related documentation to transfer to the buyer. The existing attic conversion and bathroom, along with the small blue seashell house in the side yard, are not included in the submitted plans. Two holes in the back yard are associated with completed soils testing. To see backyard go on right side of house for now to get there. Cash offers only due to property condition. No sign on property.
Features & Amenities
Property Details
Mortgage Calculator
Current Rates
Comparative Market Analysis
Residential Tier · 5 active · 5 closed
Oceanside · Single Family Residence
Listed in line with the median closed sale of $975,000. Price per sqft ($525) is a 10% discount to closed comps ($585). Comparable homes are moving quickly (avg 30 days on market).
Price Position
Aligned with the market — fair pricing for the comps.
Active Properties (5)
Active Comparables
| Address | City | Year | BD | BTH | SqFt | LotSz | LP/SqFt | LP | DIM | Score |
|---|---|---|---|---|---|---|---|---|---|---|
| 2050 Trevino Avenue | Oceanside | 1979 | 3 | 3 | 1,693 | 5,316 | $531 | $899,000 | 79 | 66 |
| 2250 Oceanside | Oceanside | 1965 | 3 | 2 | 1,188 | 15,500 | $715 | $849,000 | 5 | 66 |
| 2010 Trevino Avenue | Oceanside | 1979 | 3 | 3 | 1,526 | 4,265 | $577 | $880,000 | 2 | 65 |
| 2349 Nicklaus Dr | Oceanside | 1974 | 2 | 3 | 1,721 | 4,531 | $580 | $999,000 | 16 | 62 |
| 1706 California Street | Oceanside | 1950 | 2 | 1 | 912 | 11,761 | $1,084 | $989,000 | 18 | 61 |
| Total: 5 · Average | 2.6 | 2.4 | 1,408 | 8,274.6 | $697.4 | $923,200 | 24 | |||
| Median | 1,526 | $899,000 | ||||||||
Closed Properties (5)
Closed Comparables
| Address | City | Year | Date | BD | BTH | SqFt | LotSz | LP | SP | SP/SqFt | SP/LP | DIM | Score |
|---|---|---|---|---|---|---|---|---|---|---|---|---|---|
| 2202 Greenbrier Drive | Oceanside | 1978 | 08/04/2026 | 4 | 3 | 1,722 | 7,700 | $1.09M | $1.05M | $613 | 0.96 | 32 | 80 |
| 2302 Greenbrier Drive | Oceanside | 1970 | 06/30/2026 | 4 | 3 | 2,191 | 7,600 | $1.15M | $935,000 | $427 | 0.81 | 26 | 78 |
| 233 Grace Street | Oceanside | 1960 | 07/16/2026 | 3 | 2 | 1,770 | 10,000 | $995,000 | $1.01M | $571 | 1.01 | 30 | 75 |
| 2241 Edgewood Place | Oceanside | 1960 | 10/23/2026 | 3 | 2 | 1,176 | 5,800 | $799,000 | $820,000 | $697 | 1.03 | 23 | 75 |
| 2109 Maxson Street | Oceanside | 1970 | 06/01/2026 | 4 | 2 | 1,580 | 8,712 | $895,000 | $975,000 | $617 | 1.09 | 38 | 75 |
| Total: 5 · Average | 3.6 | 2.4 | 1,687.8 | 7,962.4 | $959,000 | $959,000 | $585 | — | 29.8 | ||||
| Median | 1,722 | $975,000 | $975,000 | ||||||||||
Market Analysis
List vs Sale $/SqFt
Sale Price Trend
Days on Market
Sale vs List Price
This analysis was generated automatically from MLS data. For an in-depth, human-reviewed valuation, contact Joseph Sardella at josephsardella@gmail.com.