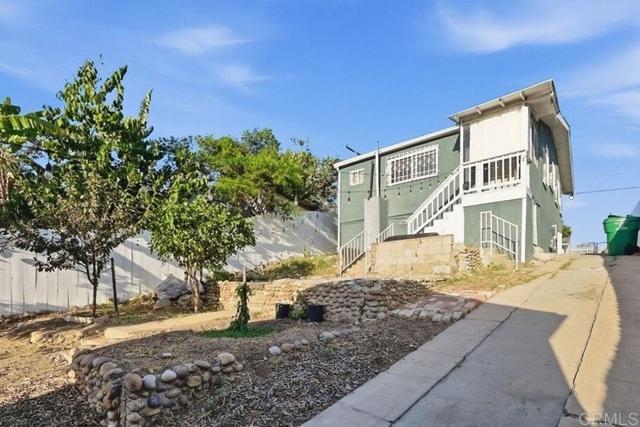
338 Hoitt Street, San Diego, CA 92102
338 Hoitt Street, San Diego, CA 92102
Property Description
THE FREEDOM OF HOMEOWNERSHIP IN THE HEART OF SAN DIEGO! Why settle for shared spaces and monthly HOA fees when you can enjoy a home with your own private yard, driveway, and room to make it yours? This charming 2-bedroom, 1.5-bath home offers an incredible opportunity to enjoy the benefits of detached living in a central San Diego location. Inside, you'll find a welcoming and functional floor plan designed for everyday comfort, complete with convenient in-unit laundry and easy access to your private outdoor space. Adding even more versatility is a detached bonus room, offering the flexibility to create a home office, personal gym, art studio, or explore the potential for a future ADU. Enjoy convenient access to Downtown San Diego, Balboa Park, Petco Park, Coronado, North Park, popular restaurants, entertainment, shopping, and major freeways. Your own space, your own possibilities, and all the convenience of city living!
Features & Amenities
Property Details
Mortgage Calculator
Current Rates
Comparative Market Analysis
Affordable Tier · 5 active · 5 closed
San Diego · Single Family Residence
Listed in line with the median closed sale of $660,000. Price per sqft ($1,008) is a 27% premium to closed comps ($794). Closed comps sold at 103% of list — strong seller's market.
Price Position
Aligned with the market — fair pricing for the comps.
Active Properties (5)
Active Comparables
| Address | City | Year | BD | BTH | SqFt | LotSz | LP/SqFt | LP | DIM | Score |
|---|---|---|---|---|---|---|---|---|---|---|
| 264 39th Street | San Diego | 1925 | 2 | 2 | 736 | 2,943 | $849 | $625,000 | 6 | 85 |
| 3170 L Street | San Diego | 2026 | 2 | 2 | 797 | 1,392 | $847 | $675,000 | 34 | 80 |
| 3990 Broadway | San Diego | 1929 | 2 | 1 | 822 | 3,851 | $700 | $575,000 | 1 | 79 |
| 35 19Th Street | San Diego | 2000 | 2 | 1 | 602 | 2,614 | $995 | $599,000 | 118 | 78 |
| 928 42nd Street | San Diego | 1952 | 3 | 1 | 868 | 2,700 | $795 | $690,000 | 12 | 66 |
| Total: 5 · Average | 2.2 | 1.4 | 765 | 2,700 | $837.2 | $632,800 | 34.2 | |||
| Median | 797 | $625,000 | ||||||||
Closed Properties (5)
Closed Comparables
| Address | City | Year | Date | BD | BTH | SqFt | LotSz | LP | SP | SP/SqFt | SP/LP | DIM | Score |
|---|---|---|---|---|---|---|---|---|---|---|---|---|---|
| 2501 L St. | San Diego | 1917 | 07/27/2026 | 2 | 1 | 632 | 1,680 | $630,000 | $630,000 | $997 | 1.00 | 82 | 86 |
| 2823 Webster Avenue | San Diego | 1913 | 04/08/2026 | 2 | 2 | 880 | 3,414 | $610,000 | $610,000 | $693 | 1.00 | 121 | 80 |
| 3162 L Street | San Diego | 2008 | 07/10/2026 | 2 | 1 | 768 | 2,000 | $649,000 | $660,000 | $859 | 1.02 | 174 | 78 |
| 729 33rd Street | San Diego | 1926 | 09/08/2026 | 3 | 2 | 880 | 5,412 | $599,900 | $665,000 | $756 | 1.11 | 105 | 78 |
| 3228 Franklin Avenue | San Diego | 2004 | 07/01/2026 | 3 | 2 | 994 | 3,794 | $635,000 | $660,000 | $664 | 1.04 | 56 | 70 |
| Total: 5 · Average | 2.4 | 1.6 | 830.8 | 3,260 | $645,000 | $645,000 | $793.8 | — | 107.6 | ||||
| Median | 880 | $660,000 | $660,000 | ||||||||||
Market Analysis
List vs Sale $/SqFt
Sale Price Trend
Days on Market
Sale vs List Price
This analysis was generated automatically from MLS data. For an in-depth, human-reviewed valuation, contact Joseph Sardella at josephsardella@gmail.com.