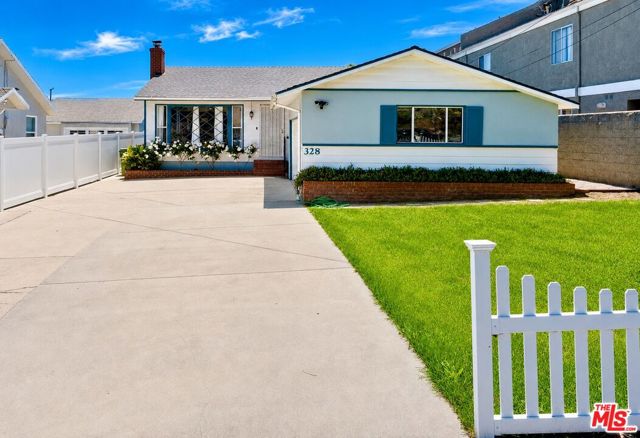
328 East Plymouth Street, Inglewood, CA 90302
328 East Plymouth Street, Inglewood, CA 90302
Property Description
Discover this spacious, airy, centrally-located home that perfectly captures the energy of vibrant Inglewood. Sitting on a tranquil tree-lined street, this charming 3-bedroom, 2-bathroom residence (1,436 Sq. Ft.) sits on a generous ~7,516 Sq. Ft. lot, offering immediate comfort plus strong long-term potential.Enjoy naturally well-lit rooms and functional living space ideal for everyday life. The expansive backyard provides a true blank canvas for your outdoor sanctuary; perfect for entertaining, gardening, or creating a personal retreat. With R3 zoning, it also offers excellent potential for an ADU or multifamily additions to expand living space or generate income.Located near SoFi Stadium and the Kia Forum, this home is just minutes from Culver City, LAX, Venice Beach, parks, shops, and endless entertainment. Don't miss this opportunity to own a versatile property in one of LA's most dynamic, fast-growing communities!
Features & Amenities
Property Details
Mortgage Calculator
Current Rates
Comparative Market Analysis
Affordable Tier · 5 active · 5 closed
Inglewood · Single Family Residence
Listed 5.8% below the median closed sale of $950,000. Closed comps sold at 104% of list — strong seller's market.
Price Position
Priced below the market — value advantage over the field.
Active Properties (5)
Active Comparables
| Address | City | Year | BD | BTH | SqFt | LotSz | LP/SqFt | LP | DIM | Score |
|---|---|---|---|---|---|---|---|---|---|---|
| 332 Plymouth Street | Inglewood | 1951 | 3 | 2 | 1,650 | 6,752 | $576 | $950,000 | 86 | 92 |
| 6225 Verdun Avenue | Los Angeles | 1947 | 3 | 2 | 1,600 | 5,851 | $574 | $919,000 | 2 | 85 |
| 624 Beach Avenue | Inglewood | 1949 | 4 | 2 | 1,182 | 4,390 | $761 | $899,900 | 65 | 82 |
| 6318 Eileen Avenue | Los Angeles | 1924 | 3 | 2 | 1,449 | 5,650 | $655 | $949,000 | 23 | 81 |
| 1316 Chester Avenue | Inglewood | 1922 | 3 | 2 | 1,284 | 5,618 | $779 | $999,999 | 31 | 80 |
| Total: 5 · Average | 3.2 | 2.0 | 1,433 | 5,652.2 | $669 | $943,579.8 | 41.4 | |||
| Median | 1,449 | $949,000 | ||||||||
Closed Properties (5)
Closed Comparables
| Address | City | Year | Date | BD | BTH | SqFt | LotSz | LP | SP | SP/SqFt | SP/LP | DIM | Score |
|---|---|---|---|---|---|---|---|---|---|---|---|---|---|
| 6235 Condon | Los Angeles | 1948 | 10/08/2026 | 2 | 2 | 1,412 | 7,707 | $875,000 | $967,000 | $685 | 1.10 | 46 | 85 |
| 6312 Verdun Avenue | Los Angeles | 1950 | 07/21/2026 | 3 | 2 | 1,260 | 6,303 | $1.03M | $1.01M | $806 | 0.98 | 209 | 85 |
| 4115 61st | Los Angeles | 1938 | 10/02/2026 | 3 | 2 | 1,361 | 6,668 | $849,800 | $875,000 | $643 | 1.03 | 31 | 84 |
| 4437 59th Place | Los Angeles | 1936 | 07/06/2026 | 3 | 2 | 1,438 | 6,378 | $899,000 | $920,000 | $640 | 1.02 | 77 | 84 |
| 4263 59th | Los Angeles | 1946 | 06/12/2026 | 3 | 2 | 1,422 | 5,376 | $899,990 | $950,000 | $668 | 1.06 | 134 | 83 |
| Total: 5 · Average | 2.8 | 2.0 | 1,378.6 | 6,486.4 | $945,400 | $945,400 | $688.4 | — | 99.4 | ||||
| Median | 1,412 | $950,000 | $950,000 | ||||||||||
Market Analysis
List vs Sale $/SqFt
Sale Price Trend
Days on Market
Sale vs List Price
This analysis was generated automatically from MLS data. For an in-depth, human-reviewed valuation, contact Joseph Sardella at josephsardella@gmail.com.