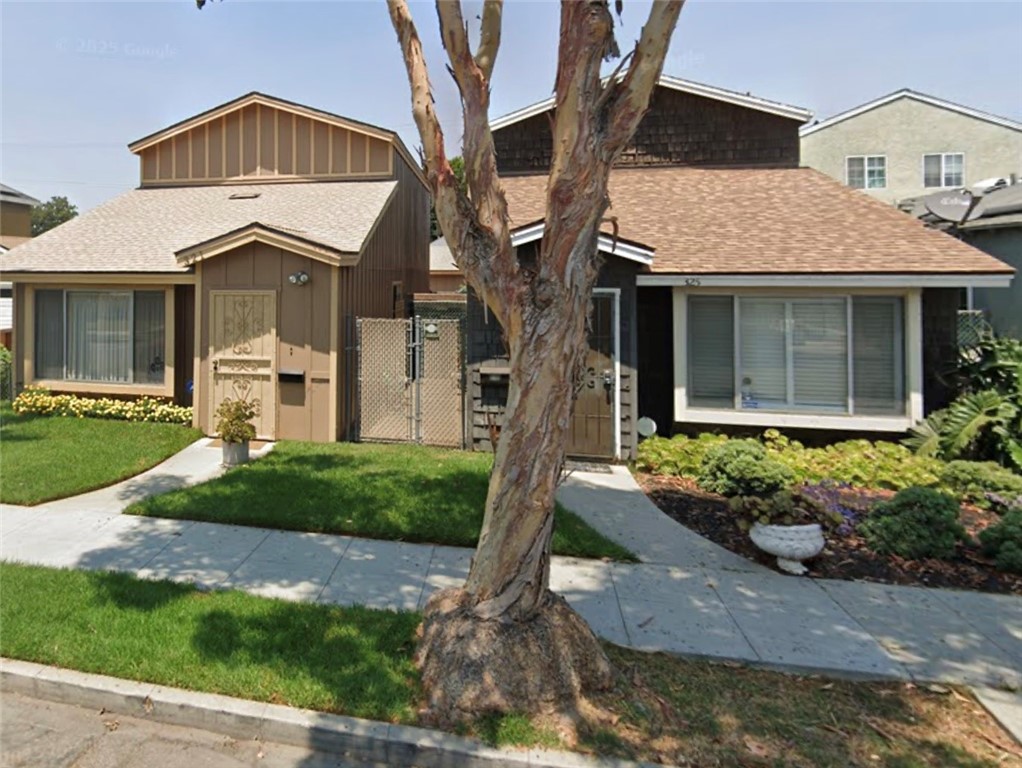
321 East Hullett, Long Beach, CA 90805
321 East Hullett, Long Beach, CA 90805
Property Description
Welcome to 321 E Hullett Street in Long Beach! Offering 3 bedrooms, 3 bathrooms, and approximately 1,581 square feet of living space, this home presents a wonderful opportunity to bring your personal style to an established Long Beach neighborhood. Whether you’re looking for your next residence or a property to make your own, discover the possibilities this home has to offer.
Features & Amenities
Property Details
Mortgage Calculator
Current Rates
About North Long Beach
This property is located in North Long Beach, a community in Long Beach. Explore more listings in this neighborhood to compare options and pricing.
View North Long Beach ListingsComparative Market Analysis
Residential Tier · 5 active · 5 closed
North Long Beach · Long Beach · Single Family Residence
Listed 3.9% above the median closed sale of $750,000. Price per sqft ($493) is a 21% discount to closed comps ($628). Closed comps sold at 103% of list — strong seller's market.
Price Position
Aligned with the market — fair pricing for the comps.
Active Properties (5)
Active Comparables
| Address | City | Year | BD | BTH | SqFt | LotSz | LP/SqFt | LP | DIM | Score |
|---|---|---|---|---|---|---|---|---|---|---|
| 243 Home | Long Beach | 1965 | 3 | 3 | 1,680 | 1,856 | $446 | $749,999 | 110 | 84 |
| 5242 Linden Avenue | Long Beach | 1977 | 3 | 2 | 1,064 | 4,664 | $686 | $730,000 | 26 | 80 |
| 1204 Poinsettia | Long Beach | 1947 | 4 | 2 | 1,364 | 3,820 | $513 | $699,999 | 10 | 79 |
| 100 Barclay | Long Beach | 1956 | 3 | 3 | 1,189 | 5,391 | $622 | $740,000 | 94 | 76 |
| 6072 Myrtle Avenue | Long Beach | 1929 | 2 | 1 | 996 | 3,713 | $718 | $714,900 | 76 | 75 |
| Total: 5 · Average | 3.0 | 2.2 | 1,258.6 | 3,888.8 | $597 | $726,979.6 | 63.2 | |||
| Median | 1,189 | $730,000 | ||||||||
Closed Properties (5)
Closed Comparables
| Address | City | Year | Date | BD | BTH | SqFt | LotSz | LP | SP | SP/SqFt | SP/LP | DIM | Score |
|---|---|---|---|---|---|---|---|---|---|---|---|---|---|
| 447 Adair Street | Long Beach | 1977 | 09/28/2026 | 3 | 2 | 1,102 | 2,806 | $715,000 | $750,000 | $681 | 1.05 | 54 | 88 |
| 417 Adair Street | Long Beach | 1956 | 05/07/2026 | 3 | 2 | 1,007 | 2,870 | $695,000 | $715,000 | $710 | 1.03 | 41 | 82 |
| 341 Ellis | Long Beach | 1931 | 08/14/2026 | 3 | 1 | 1,360 | 4,747 | $699,999 | $720,000 | $529 | 1.03 | 69 | 80 |
| 5641 Linden Ave | Long Beach | 1923 | 04/30/2026 | 3 | 2 | 1,262 | 4,867 | $770,000 | $785,000 | $622 | 1.02 | 56 | 79 |
| 6021 Olive Avenue | Long Beach | 1961 | 07/09/2026 | 2 | 2 | 1,284 | 4,848 | $760,000 | $765,000 | $596 | 1.01 | 69 | 79 |
| Total: 5 · Average | 2.8 | 1.8 | 1,203 | 4,027.6 | $747,000 | $747,000 | $627.6 | — | 57.8 | ||||
| Median | 1,262 | $750,000 | $750,000 | ||||||||||
Market Analysis
List vs Sale $/SqFt
Sale Price Trend
Days on Market
Sale vs List Price
This analysis was generated automatically from MLS data. For an in-depth, human-reviewed valuation, contact Joseph Sardella at josephsardella@gmail.com.