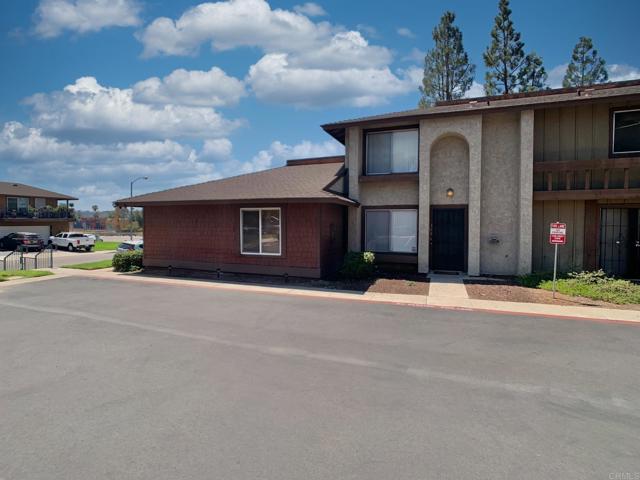
319 Sun Court, El Cajon, CA 92021
319 Sun Court, El Cajon, CA 92021
Property Description
upgraded in 2024 and move in ready! this 3 bedroom,1.5 bath townhome in the Pepper Drive Estates community offerers a bright, comfortable interior an a convenient El Cajon location. The upgraded kitchen features whit cabinetry,quartz countertops,stainless steel appliances, recessed lighting mondern finishes,while updated flooringand fresh, neutral tones create a light and inviting feel thoughout the main living areas. all three bedrooms are located upstairs along with the full bath, while a convenient half bath is located downstairs. Step outside to your own private fenced backyard,perfedt for relaxing,entertaining or enjoying the San Diego sunshire. A dedicated laundry closet with washer & dryer is conveniently located off the patio. The home also includes a sharded two car garage. Centrally located with convieient access to El Cajon,freeways , shopping , kining and other areas though out San Diego country. A wonderful opportunity to enjoy an upgraded townhome in a convenient east country location.
Features & Amenities
Property Details
Mortgage Calculator
Current Rates
Comparative Market Analysis
Affordable Tier · 5 active · 5 closed
El Cajon · Townhouse
Listed 6.9% below the median closed sale of $536,000.
Price Position
Priced below the market — value advantage over the field.
Active Properties (5)
Active Comparables
| Address | City | Year | BD | BTH | SqFt | LotSz | LP/SqFt | LP | DIM | Score |
|---|---|---|---|---|---|---|---|---|---|---|
| 1248 Denver Lane | El Cajon | 1973 | 3 | 2 | 1,116 | 1,307 | $448 | $499,999 | 12 | 84 |
| 11937 Royal Road | El Cajon | 1974 | 3 | 2 | 1,323 | 3 | $378 | $499,900 | 74 | 74 |
| 1218 Green Garden Dr | El Cajon | 1970 | 2 | 2 | 1,116 | 162,914 | $435 | $485,000 | 101 | 74 |
| 390 Madison Avenue | El Cajon | 1982 | 2 | 2 | 1,300 | 0 | $328 | $426,000 | 79 | 74 |
| 1321 Greenfield Drive | El Cajon | 2000 | 2 | 2 | 1,024 | 46,174 | $439 | $450,000 | 10 | 69 |
| Total: 5 · Average | 2.4 | 2.0 | 1,175.8 | 52,599.5 | $405.6 | $472,179.8 | 55.2 | |||
| Median | 1,116 | $485,000 | ||||||||
Closed Properties (5)
Closed Comparables
| Address | City | Year | Date | BD | BTH | SqFt | LotSz | LP | SP | SP/SqFt | SP/LP | DIM | Score |
|---|---|---|---|---|---|---|---|---|---|---|---|---|---|
| 1652 Summertime Dr | El Cajon | 1974 | 10/19/2026 | 3 | 2 | 1,136 | 209,959 | $449,900 | $449,900 | $396 | 1.00 | 44 | 93 |
| 1176 Denver Lane | El Cajon | 1973 | 08/14/2026 | 3 | 2 | 1,344 | 1,543 | $536,000 | $536,000 | $399 | 1.00 | 43 | 78 |
| 1446 Finch Street | El Cajon | 1975 | 03/03/2026 | 2 | 2 | 1,151 | 282,704 | $549,900 | $536,000 | $466 | 0.97 | 83 | 74 |
| 11961 Sapota Dr | Lakeside | 1988 | 07/13/2026 | 3 | 3 | 1,140 | 436 | $577,777 | $566,000 | $496 | 0.98 | 349 | 73 |
| 736 Mollison Avenue | El Cajon | 1982 | 05/15/2026 | 2 | 2 | 1,004 | 114,127 | $500,000 | $500,000 | $498 | 1.00 | 77 | 73 |
| Total: 5 · Average | 2.6 | 2.2 | 1,155 | 121,753.8 | $517,580 | $517,580 | $451 | — | 119.2 | ||||
| Median | 1,140 | $536,000 | $536,000 | ||||||||||
Market Analysis
List vs Sale $/SqFt
Sale Price Trend
Days on Market
Sale vs List Price
This analysis was generated automatically from MLS data. For an in-depth, human-reviewed valuation, contact Joseph Sardella at josephsardella@gmail.com.