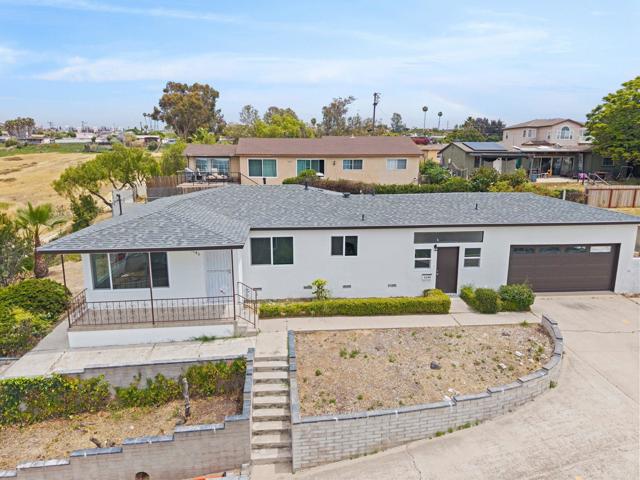
3140 East 2nd Street, National City, CA 91950
3140 East 2nd Street, National City, CA 91950
Property Description
Beautifully remodeled 3-bedroom, 2 bath home with a stunning hillside view from the living room. This home features a new roof, new flooring, and updated bathrooms and kitchen. Enjoy the natural breeze and peaceful setting while still being conveniently located near popular restaurants, shopping and freeway access. Spacious 2 car garage and a great location to make this your home.
Features & Amenities
Property Details
Mortgage Calculator
Current Rates
Comparative Market Analysis
Residential Tier · 5 active · 5 closed
National City · Single Family Residence
Listed 10.1% above the median closed sale of $736,000. Closed comps sold at 100% of list — strong seller's market.
Price Position
Positioned above the market — commands a premium.
Active Properties (5)
Active Comparables
| Address | City | Year | BD | BTH | SqFt | LotSz | LP/SqFt | LP | DIM | Score |
|---|---|---|---|---|---|---|---|---|---|---|
| 1003 Manchester Street | National City | 1959 | 3 | 2 | 1,802 | 8,276 | $472 | $849,999 | 32 | 91 |
| 5472 San Onofre | San Diego | 1957 | 4 | 2 | 1,800 | 7,600 | $500 | $900,000 | 122 | 87 |
| 3002 11th Street | National City | 1965 | 3 | 2 | 1,648 | 6,534 | $464 | $764,000 | 95 | 85 |
| 2121 4Th Street | National City | 1960 | 3 | 2 | 1,528 | 5,227 | $491 | $749,999 | 128 | 83 |
| 2325 14Th Street | National City | 1977 | 3 | 2 | 1,514 | 6,534 | $495 | $749,000 | 5 | 82 |
| Total: 5 · Average | 3.2 | 2.0 | 1,658.4 | 6,834.2 | $484.4 | $802,599.6 | 76.4 | |||
| Median | 1,648 | $764,000 | ||||||||
Closed Properties (5)
Closed Comparables
| Address | City | Year | Date | BD | BTH | SqFt | LotSz | LP | SP | SP/SqFt | SP/LP | DIM | Score |
|---|---|---|---|---|---|---|---|---|---|---|---|---|---|
| 1417 58Th Street | San Diego | 1963 | 08/14/2026 | 4 | 2 | 1,730 | 7,405 | $885,000 | $880,000 | $509 | 0.99 | 81 | 86 |
| 2534 Melrose Street | National City | 1961 | 09/15/2026 | 3 | 2 | 1,337 | 5,400 | $719,900 | $725,000 | $542 | 1.01 | 54 | 84 |
| 2747 Melrose | National City | — | 02/13/2026 | 3 | 2 | 1,876 | 7,000 | $839,999 | $835,000 | $445 | 0.99 | 25 | 80 |
| 2526 Melrose Street | National City | 1961 | 07/10/2026 | 3 | 2 | 1,088 | 5,400 | $736,000 | $736,000 | $676 | 1.00 | 39 | 80 |
| 2525 Melrose Street | National City | 1960 | 12/02/2025 | 3 | 2 | 1,053 | 6,700 | $675,000 | $690,000 | $655 | 1.02 | 39 | 79 |
| Total: 5 · Average | 3.2 | 2.0 | 1,416.8 | 6,381 | $773,200 | $773,200 | $565.4 | — | 47.6 | ||||
| Median | 1,337 | $736,000 | $736,000 | ||||||||||
Market Analysis
List vs Sale $/SqFt
Sale Price Trend
Days on Market
Sale vs List Price
This analysis was generated automatically from MLS data. For an in-depth, human-reviewed valuation, contact Joseph Sardella at josephsardella@gmail.com.