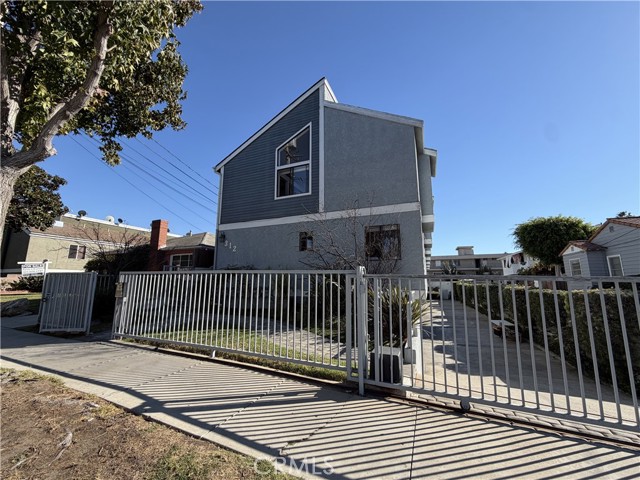
312 East Plymouth Street, 4, Inglewood, CA 90302
312 East Plymouth Street, 4, Inglewood, CA 90302
Property Description
This spacious, move-in-ready townhome offers a comfortable and inviting living space with two bedrooms, two and a half bathrooms, and an abundance of natural light. Both bedrooms feature mirrored wardrobe closets, while the interior has been freshly painted and updated with wood flooring. The kitchen includes a stove and built-in microwave, complemented by high vaulted ceilings, a skylight, and a charming window seat. Additional highlights include an in-unit laundry area with hookups for a side-by-side washer and dryer, ceiling fans, and a convenient linen closet. The property also features a large two-car garage with ample storage space. Ideally located near shops, restaurants, and everyday conveniences.
Features & Amenities
Property Details
Mortgage Calculator
Current Rates
Comparative Market Analysis
Affordable Tier · 4 active · 5 closed
Inglewood · Townhouse
Listed in line with the median closed sale of $490,000.
Price Position
Aligned with the market — fair pricing for the comps.
Active Properties (4)
Active Comparables
| Address | City | Year | BD | BTH | SqFt | LotSz | LP/SqFt | LP | DIM | Score |
|---|---|---|---|---|---|---|---|---|---|---|
| 534 Hazel Street | Inglewood | 1981 | 2 | 3 | 1,177 | 13,083 | $476 | $560,000 | 11 | 84 |
| 620 Hyde Park | Inglewood | 1983 | 2 | 2 | 1,149 | 65,895 | $474 | $545,000 | 98 | 80 |
| 882 Victor Avenue | Inglewood | 1973 | 2 | 2 | 992 | 37,487 | $489 | $485,000 | 3 | 78 |
| 532 Venice Way | Inglewood | 1989 | 2 | 2 | 1,320 | 24,065 | $416 | $549,000 | 34 | 75 |
| Total: 4 · Average | 2.0 | 2.3 | 1,159.5 | 35,132.5 | $463.75 | $534,750 | 36.5 | |||
| Median | 1,177 | $549,000 | ||||||||
Closed Properties (5)
Closed Comparables
| Address | City | Year | Date | BD | BTH | SqFt | LotSz | LP | SP | SP/SqFt | SP/LP | DIM | Score |
|---|---|---|---|---|---|---|---|---|---|---|---|---|---|
| 547 Hazel Street | Inglewood | 1987 | 07/29/2026 | 2 | 2 | 882 | 20,017 | $490,000 | $490,000 | $556 | 1.00 | 63 | 84 |
| 708 Eucalyptus Avenue | Inglewood | 1989 | 05/13/2026 | 2 | 2 | 914 | 10,012 | $445,000 | $450,000 | $492 | 1.01 | 78 | 84 |
| 919 N Inglewood Ave | Inglewood | 1972 | 11/13/2025 | 2 | 2 | 973 | 0 | $499,000 | $460,000 | $473 | 0.92 | 168 | 82 |
| 532 Venice Way | Inglewood | 1989 | 11/18/2025 | 2 | 2 | 1,320 | 24,065 | $559,000 | $550,000 | $417 | 0.98 | 170 | 74 |
| 726 Fir | Inglewood | 1988 | 02/27/2026 | 2 | 2 | 859 | 19,178 | $495,000 | $495,000 | $576 | 1.00 | 40 | 72 |
| Total: 5 · Average | 2.0 | 2.0 | 989.6 | 18,318 | $489,000 | $489,000 | $502.8 | — | 103.8 | ||||
| Median | 914 | $490,000 | $490,000 | ||||||||||
Market Analysis
List vs Sale $/SqFt
Sale Price Trend
Days on Market
Sale vs List Price
This analysis was generated automatically from MLS data. For an in-depth, human-reviewed valuation, contact Joseph Sardella at josephsardella@gmail.com.