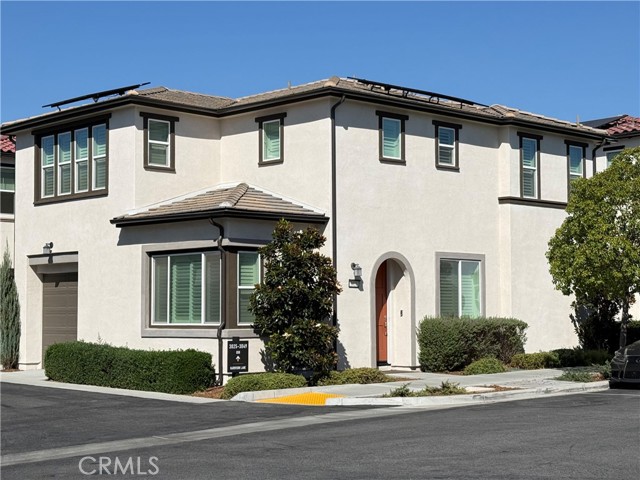
3029 Harrison Lane, Simi Valley, CA 93065
3029 Harrison Lane, Simi Valley, CA 93065
Property Description
New construction living in Sycamore Grove, one of Simi Valley's most sought after new home communities. The community is on a quiet street just few minutes from Simi Valley Town Center and close to the 118 freeway. Three bedrooms plus 3 baths and 2,075 square feet built in 2022. There are 10 panels solar(microinverters), the solar lease is $87.00 monthly.
Features & Amenities
Property Details
Mortgage Calculator
Current Rates
Comparative Market Analysis
Residential Tier · 5 active · 5 closed
Simi Valley · Single Family Residence
Listed 11.2% above the median closed sale of $890,000. Closed comps sold at 100% of list — strong seller's market.
Price Position
Positioned above the market — commands a premium.
Active Properties (5)
Active Comparables
| Address | City | Year | BD | BTH | SqFt | LotSz | LP/SqFt | LP | DIM | Score |
|---|---|---|---|---|---|---|---|---|---|---|
| 3037 Tallahassee | Simi Valley | 2023 | 3 | 4 | 1,652 | 1,253 | $512 | $845,000 | 16 | 76 |
| 3041 Tallahassee Lane | Simi Valley | 2023 | 4 | 4 | 1,760 | 1,367 | $482 | $849,000 | 128 | 74 |
| 2491 Castlemont Court | Simi Valley | 1968 | 4 | 3 | 1,997 | 8,850 | $498 | $995,000 | 21 | 72 |
| 3796 Diamond Court | Simi Valley | 1973 | 4 | 3 | 2,035 | 5,903 | $442 | $899,000 | 17 | 70 |
| 2526 Glenhurst Court | Simi Valley | 1984 | 4 | 3 | 2,051 | 6,098 | $463 | $949,999 | 41 | 68 |
| Total: 5 · Average | 3.8 | 3.4 | 1,899 | 4,694.2 | $479.4 | $907,599.8 | 44.6 | |||
| Median | 1,997 | $899,000 | ||||||||
Closed Properties (5)
Closed Comparables
| Address | City | Year | Date | BD | BTH | SqFt | LotSz | LP | SP | SP/SqFt | SP/LP | DIM | Score |
|---|---|---|---|---|---|---|---|---|---|---|---|---|---|
| 3067 Harrison Lane | Simi Valley | 2022 | 05/19/2026 | 3 | 3 | 1,830 | 2,227 | $899,000 | $890,000 | $486 | 0.99 | 55 | 87 |
| 3073 Harrison Lane | Simi Valley | 2022 | 09/18/2026 | 4 | 4 | 2,271 | 2,799 | $949,999 | $920,000 | $405 | 0.97 | 66 | 79 |
| 3033 Tallahassee Lane | Simi Valley | 2023 | 07/31/2026 | 3 | 4 | 1,652 | 1,629 | $894,995 | $885,000 | $536 | 0.99 | 55 | 77 |
| 3186 Galena Avenue | Simi Valley | 1964 | 06/02/2026 | 5 | 3 | 2,071 | 6,100 | $799,000 | $860,000 | $415 | 1.08 | 32 | 76 |
| 2253 Medina Avenue | Simi Valley | 1964 | 08/04/2026 | 4 | 3 | 2,139 | 6,534 | $995,000 | $995,000 | $465 | 1.00 | 46 | 72 |
| Total: 5 · Average | 3.8 | 3.4 | 1,992.6 | 3,857.8 | $910,000 | $910,000 | $461.4 | — | 50.8 | ||||
| Median | 2,071 | $890,000 | $890,000 | ||||||||||
Market Analysis
List vs Sale $/SqFt
Sale Price Trend
Days on Market
Sale vs List Price
This analysis was generated automatically from MLS data. For an in-depth, human-reviewed valuation, contact Joseph Sardella at josephsardella@gmail.com.