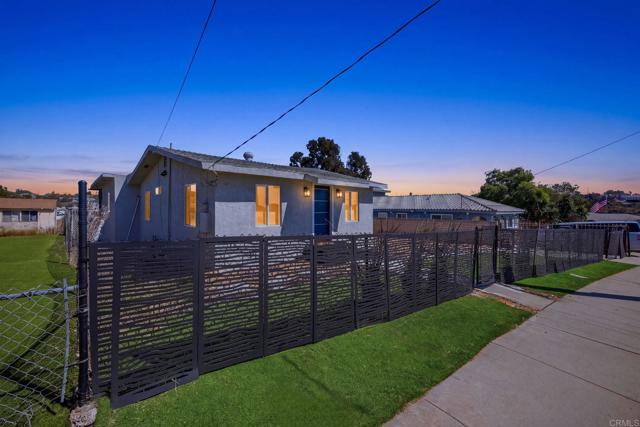
2959 Ridgeway Drive, National City, CA 91950
2959 Ridgeway Drive, National City, CA 91950
Property Description
Entertaining Offers between $695k to $749k !!! Single story home, located on a cul-de-sac on large lot overlooking the canyons. Quiet and serenity surround this beautifully remodeled home. Home sits on 8,000 sqft flat lot with plenty of driveway space. Kitchen features quartz countertops, stainless steel appliances. Other upgrades include laminate wood flooring, walk in showers, and more!... come check this home out today!
Features & Amenities
Property Details
Mortgage Calculator
Current Rates
Comparative Market Analysis
Affordable Tier · 5 active · 5 closed
National City · Single Family Residence
Listed in line with the median closed sale of $750,000. Closed comps sold at 107% of list — strong seller's market.
Price Position
Aligned with the market — fair pricing for the comps.
Active Properties (5)
Active Comparables
| Address | City | Year | BD | BTH | SqFt | LotSz | LP/SqFt | LP | DIM | Score |
|---|---|---|---|---|---|---|---|---|---|---|
| 2463 Rancho Drive | San Diego | 1948 | 3 | 2 | 1,185 | 7,200 | $608 | $720,000 | 135 | 84 |
| 2573 Calle Aguadulce | San Diego | 1957 | 3 | 2 | 1,353 | 6,098 | $591 | $799,900 | 46 | 82 |
| 1810 Granger Avenue | National City | 1950 | 4 | 2 | 1,032 | 5,662 | $751 | $775,000 | 16 | 80 |
| 2595 Calle Tres Lomas | San Diego | 1959 | 3 | 2 | 1,233 | 6,500 | $606 | $747,000 | 60 | 79 |
| 5949 Tonawanda Drive | San Diego | 1979 | 3 | 2 | 1,568 | 5,486 | $478 | $750,000 | 73 | 77 |
| Total: 5 · Average | 3.2 | 2.0 | 1,274.2 | 6,189.2 | $606.8 | $758,380 | 66 | |||
| Median | 1,233 | $750,000 | ||||||||
Closed Properties (5)
Closed Comparables
| Address | City | Year | Date | BD | BTH | SqFt | LotSz | LP | SP | SP/SqFt | SP/LP | DIM | Score |
|---|---|---|---|---|---|---|---|---|---|---|---|---|---|
| 2905 Ridgeway Drive | National City | 1930 | 08/14/2026 | 3 | 2 | 1,226 | 18,731 | $599,999 | $800,000 | $653 | 1.33 | 44 | 91 |
| 2585 Deauville Street | San Diego | 1961 | 10/01/2026 | 4 | 2 | 1,412 | 7,300 | $795,000 | $795,000 | $563 | 1.00 | 82 | 84 |
| 5762 Calle Sal Si Puedes | San Diego | 1960 | 11/25/2025 | 3 | 2 | 1,200 | 10,400 | $740,000 | $740,000 | $617 | 1.00 | 68 | 80 |
| 2862 Callejon | San Diego | 1960 | 02/09/2026 | 3 | 3 | 1,480 | 8,200 | $725,000 | $750,000 | $507 | 1.03 | 33 | 76 |
| 5603 Winchester St | San Diego | 1958 | 06/09/2026 | 2 | 1 | 874 | 6,900 | $669,999 | $660,000 | $755 | 0.98 | 76 | 73 |
| Total: 5 · Average | 3.0 | 2.0 | 1,238.4 | 10,306.2 | $749,000 | $749,000 | $619 | — | 60.6 | ||||
| Median | 1,226 | $750,000 | $750,000 | ||||||||||
Market Analysis
List vs Sale $/SqFt
Sale Price Trend
Days on Market
Sale vs List Price
This analysis was generated automatically from MLS data. For an in-depth, human-reviewed valuation, contact Joseph Sardella at josephsardella@gmail.com.