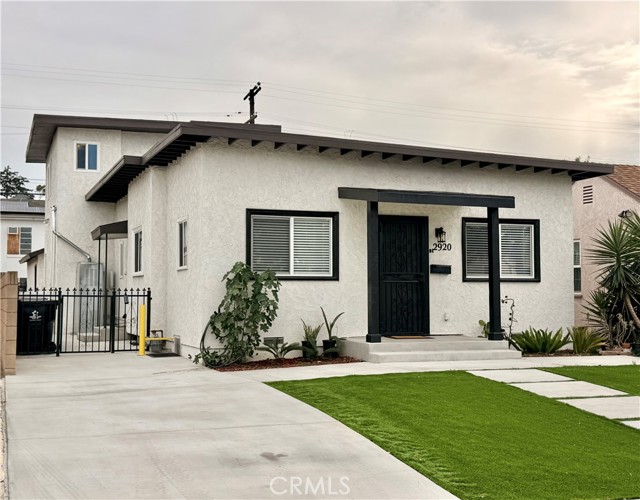
2920 West Shorb, Alhambra, CA 91803
2920 West Shorb, Alhambra, CA 91803
Property Description
Welcome to a charming two-story home offering the perfect blend of comfort, location, and opportunity. Featuring 3 bedrooms, 3 baths and a functional floor plan, abundant natural light, and is ready for your personal touch. Enjoy the best of Alhambra living with easy access to dining, shopping, parks, schools, Freeways 60, 710, and 10, and, major conveniences with top rated k-12 schools.. Whether you’re a first-time buyer, investor, or looking to create your dream home, this is an opportunity to own in a highly desirable San Gabriel Valley neighborhood. Some pictures are virtually staged.
Features & Amenities
Property Details
Mortgage Calculator
Current Rates
Comparative Market Analysis
Affordable Tier · 5 active · 5 closed
Alhambra · Single Family Residence
Listed 9.4% below the median closed sale of $1,034,500. Closed comps sold at 100% of list — strong seller's market.
Price Position
Priced below the market — value advantage over the field.
Active Properties (5)
Active Comparables
| Address | City | Year | BD | BTH | SqFt | LotSz | LP/SqFt | LP | DIM | Score |
|---|---|---|---|---|---|---|---|---|---|---|
| 2920 Covina Street | Los Angeles | 1948 | 3 | 2 | 1,258 | 4,966 | $675 | $849,000 | 24 | 84 |
| 2456 Endicott | Los Angeles | 1961 | 3 | 2 | 1,456 | 6,483 | $617 | $898,000 | 86 | 81 |
| 2912 Covina Street | Los Angeles | 1938 | 3 | 2 | 1,130 | 3,527 | $708 | $800,000 | 102 | 78 |
| 5368 Oakland Street | Los Angeles | 1936 | 2 | 2 | 1,380 | 6,409 | $724 | $999,000 | 24 | 76 |
| 2500 Carlos St | Alhambra | 1947 | 3 | 1 | 1,174 | 8,514 | $686 | $805,000 | 96 | 74 |
| Total: 5 · Average | 2.8 | 1.8 | 1,279.6 | 5,979.8 | $682 | $870,200 | 66.4 | |||
| Median | 1,258 | $849,000 | ||||||||
Closed Properties (5)
Closed Comparables
| Address | City | Year | Date | BD | BTH | SqFt | LotSz | LP | SP | SP/SqFt | SP/LP | DIM | Score |
|---|---|---|---|---|---|---|---|---|---|---|---|---|---|
| 2904 Front Street | Alhambra | 1937 | 08/13/2026 | 3 | 2 | 1,463 | 4,823 | $860,000 | $865,000 | $591 | 1.01 | 83 | 92 |
| 2909 FRONT | Alhambra | 1923 | 04/06/2026 | 3 | 3 | 1,452 | 4,748 | $889,000 | $865,000 | $596 | 0.97 | 83 | 87 |
| 2901 Front St | Alhambra | 1928 | 04/13/2026 | 3 | 2 | 1,335 | 4,851 | $988,000 | $1.03M | $775 | 1.05 | 48 | 85 |
| 2820 Front | Alhambra | 1926 | 05/08/2026 | 3 | 2 | 1,282 | 4,834 | $1.05M | $1.05M | $819 | 1.00 | 45 | 83 |
| 1817 Elm Street | Alhambra | 1930 | 05/12/2026 | 3 | 2 | 1,372 | 6,760 | $1.10M | $1.08M | $784 | 0.98 | 47 | 79 |
| Total: 5 · Average | 3.0 | 2.2 | 1,380.8 | 5,203.2 | $977,939 | $977,939 | $713 | — | 61.2 | ||||
| Median | 1,372 | $1.03M | $1.03M | ||||||||||
Market Analysis
List vs Sale $/SqFt
Sale Price Trend
Days on Market
Sale vs List Price
This analysis was generated automatically from MLS data. For an in-depth, human-reviewed valuation, contact Joseph Sardella at josephsardella@gmail.com.