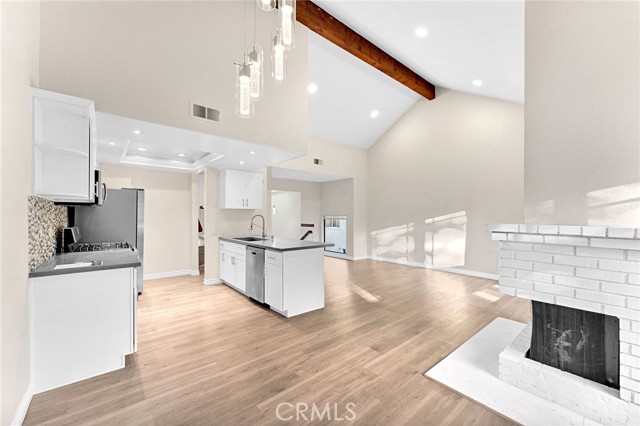
292 Palmer Street, C2, Costa Mesa, CA 92627
292 Palmer Street, C2, Costa Mesa, CA 92627
Property Description
Welcome to the highly desirable neighborhood of Eastside Heights Costa Mesa - Beautiful condo offers a perfect blend of modern comfort, generous living space and in a prime coastal Orange County area. Step inside and experience a spacious floorplan, abundant amount of natural light. The floorplan offers 2 bedroom suites offering privacy and convenience, both with walk-in closets plus a guest bathroom by the kitchen. Situated in Eastside Heights, you're moments from 17th Street shopping and dining and to nearby Newport Beach Peninsula.
Features & Amenities
Property Details
Mortgage Calculator
Current Rates
Comparative Market Analysis
Affordable Tier · 5 active · 5 closed
Costa Mesa · Condominium
Listed 3.9% below the median closed sale of $1,300,000.
Price Position
Aligned with the market — fair pricing for the comps.
Active Properties (5)
Active Comparables
| Address | City | Year | BD | BTH | SqFt | LotSz | LP/SqFt | LP | DIM | Score |
|---|---|---|---|---|---|---|---|---|---|---|
| 280 Cagney Lane | Newport Beach | 1980 | 2 | 2 | 1,136 | 38,736 | $1,166 | $1.32M | 198 | 83 |
| 2575 Elden Avenue | Costa Mesa | 1987 | 3 | 3 | 1,369 | 20,153 | $825 | $1.13M | 53 | 72 |
| 366 Villa Point | Newport Beach | 1990 | 2 | 2 | 1,255 | 379,508 | $1,067 | $1.34M | 107 | 70 |
| 797 Leeward | Costa Mesa | 2017 | 3 | 4 | 2,053 | 80,261 | $582 | $1.20M | 24 | 67 |
| 372 Villa Point Drive | Newport Beach | 1991 | 2 | 2 | 1,001 | 0 | $1,198 | $1.20M | 123 | 63 |
| Total: 5 · Average | 2.4 | 2.6 | 1,362.8 | 129,664.5 | $967.6 | $1.24M | 101 | |||
| Median | 1,255 | $1.20M | ||||||||
Closed Properties (5)
Closed Comparables
| Address | City | Year | Date | BD | BTH | SqFt | LotSz | LP | SP | SP/SqFt | SP/LP | DIM | Score |
|---|---|---|---|---|---|---|---|---|---|---|---|---|---|
| 811 15th | Newport Beach | 1980 | 08/11/2026 | 2 | 3 | 1,462 | 49,781 | $1.35M | $1.32M | $901 | 0.98 | 60 | 91 |
| 1086 Buckingham | Newport Beach | 1965 | 05/28/2026 | 2 | 3 | 1,368 | 82,360 | $1.09M | $1.18M | $859 | 1.07 | 20 | 85 |
| 280 Cagney Lane | Newport Beach | 1980 | 08/14/2026 | 2 | 2 | 1,663 | 0 | $1.40M | $1.30M | $782 | 0.93 | 128 | 84 |
| 1074 Buckingham | Newport Beach | 1965 | 04/23/2026 | 2 | 3 | 1,368 | 82,360 | $1.29M | $1.32M | $965 | 1.02 | 27 | 84 |
| 950 Cagney | Newport Beach | 1983 | 06/01/2026 | 2 | 2 | 1,320 | 18,208 | $1.15M | $1.10M | $833 | 0.96 | 52 | 84 |
| Total: 5 · Average | 2.0 | 2.6 | 1,436.2 | 58,177.25 | $1.24M | $1.24M | $868 | — | 57.4 | ||||
| Median | 1,368 | $1.30M | $1.30M | ||||||||||
Market Analysis
List vs Sale $/SqFt
Sale Price Trend
Days on Market
Sale vs List Price
This analysis was generated automatically from MLS data. For an in-depth, human-reviewed valuation, contact Joseph Sardella at josephsardella@gmail.com.