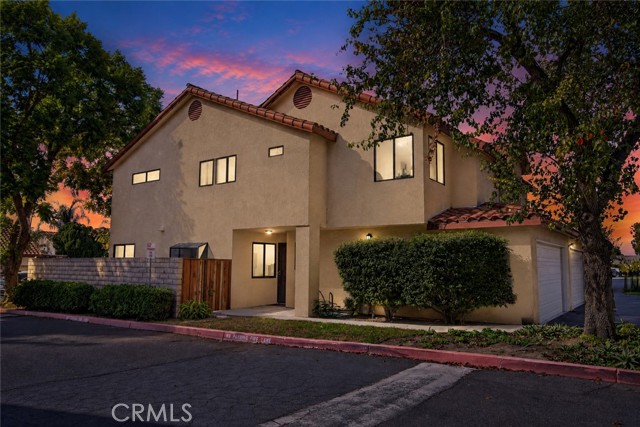
2567 Chandler Avenue, Simi Valley, CA 93065
2567 Chandler Avenue, Simi Valley, CA 93065
Property Description
Looking for a Simi Valley townhome with your own backyard, soaring ceilings, and fresh updates? This inviting 3-bedroom, 2.5-bath home offers 1,378 square feet of comfortable living space with new carpet, fresh paint throughout, and newly painted kitchen cabinets. Step through the wood front door with decorative glass into a tiled entry accented by a white-railed staircase. The kitchen features freshly painted white cabinetry, granite countertops and a coordinating backsplash, stainless steel appliances, a gas range, recessed lighting, and ample storage. A garden window above the sink welcomes natural light and provides a spot for plants or fresh herbs. The raised serving counter connects the kitchen to the adjacent dining room, making serving meals and entertaining convenient. Windows on two sides brighten the dining room, creating an inviting setting for morning coffee or dinner with friends. The spacious living room features a dramatic vaulted ceiling, recessed lighting, and a fireplace with a tile surround and decorative mantel. Sliding glass doors open to the enclosed backyard and patio, with space for outdoor dining, a barbecue, and a comfortable seating area. Whether enjoying a quiet morning outside or having friends over, the backyard is a welcome extension of the living space. Upstairs, the primary suite features an attached bathroom and a large walk-in closet. Two additional bedrooms offer flexibility for guests or a home office. An attached garage adds everyday convenience. Located adjacent to Mayfair Park, this home offers access to outdoor recreation, local shopping, and restaurants. Simi Valley Town Center provides additional shopping, dining, and entertainment options, while access to the 118 freeway connects you toward Moorpark and the San Fernando Valley. With a backyard, attached garage, vaulted ceilings, LOW HOA and refreshed interiors, this Simi Valley townhome for sale offers a welcoming place to make your next move.
Features & Amenities
Property Details
Mortgage Calculator
Current Rates
Comparative Market Analysis
Affordable Tier · 5 active · 5 closed
Simi Valley · Single Family Residence
Listed 8.2% below the median closed sale of $675,000. Price per sqft ($450) is a 19% discount to closed comps ($554). Closed comps sold at 100% of list — strong seller's market.
Price Position
Priced below the market — value advantage over the field.
Active Properties (5)
Active Comparables
| Address | City | Year | BD | BTH | SqFt | LotSz | LP/SqFt | LP | DIM | Score |
|---|---|---|---|---|---|---|---|---|---|---|
| 2776 Erringer Road | Simi Valley | 1988 | 3 | 3 | 1,377 | 1,212 | $450 | $619,900 | 2 | 87 |
| 437 Scatterwood Lane | Simi Valley | 2000 | 3 | 3 | 1,294 | 1,294 | $539 | $698,000 | 157 | 77 |
| 1207 Graham Street | Simi Valley | 1961 | 4 | 2 | 1,226 | 7,840 | $570 | $699,000 | 16 | 73 |
| 2093 Covington Avenue | Simi Valley | 1974 | 2 | 2 | 982 | 3,500 | $626 | $615,000 | 9 | 62 |
| 895 Appleton Road | Simi Valley | 1964 | 3 | 2 | 1,684 | 7,405 | $413 | $695,000 | 61 | 55 |
| Total: 5 · Average | 3.0 | 2.4 | 1,312.6 | 4,250.2 | $519.6 | $665,380 | 49 | |||
| Median | 1,294 | $695,000 | ||||||||
Closed Properties (5)
Closed Comparables
| Address | City | Year | Date | BD | BTH | SqFt | LotSz | LP | SP | SP/SqFt | SP/LP | DIM | Score |
|---|---|---|---|---|---|---|---|---|---|---|---|---|---|
| 2527 Chandler Avenue | Simi Valley | 1987 | 09/14/2026 | 3 | 3 | 1,378 | 3,310 | $679,000 | $655,000 | $475 | 0.96 | 81 | 94 |
| 1853 Hillary Ct | Simi Valley | 1969 | 05/04/2026 | 3 | 2 | 1,310 | 5,467 | $699,000 | $675,000 | $515 | 0.97 | 34 | 73 |
| 1433 Graham | Simi Valley | 1961 | 09/08/2026 | 4 | 2 | 1,226 | 7,405 | $675,000 | $699,000 | $570 | 1.04 | 40 | 73 |
| 1662 Ahart Street | Simi Valley | 1961 | 09/16/2026 | 3 | 2 | 1,058 | 7,840 | $679,900 | $712,500 | $673 | 1.05 | 99 | 71 |
| 1735 Spence Street | Simi Valley | 1961 | 10/09/2026 | 4 | 2 | 1,227 | 7,840 | $659,900 | $660,000 | $538 | 1.00 | 66 | 71 |
| Total: 5 · Average | 3.4 | 2.2 | 1,239.8 | 6,372.4 | $680,300 | $680,300 | $554.2 | — | 64 | ||||
| Median | 1,227 | $675,000 | $675,000 | ||||||||||
Market Analysis
List vs Sale $/SqFt
Sale Price Trend
Days on Market
Sale vs List Price
This analysis was generated automatically from MLS data. For an in-depth, human-reviewed valuation, contact Joseph Sardella at josephsardella@gmail.com.