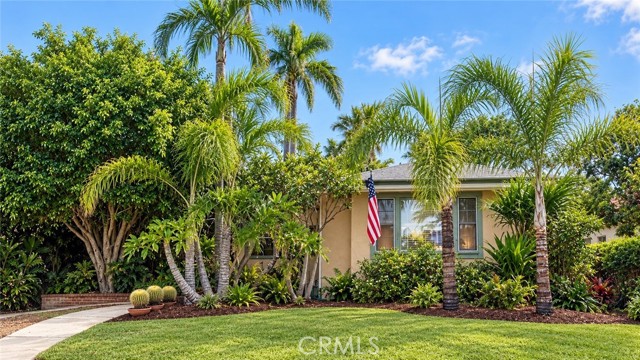
2536 Montclair, San Diego, CA 92104
2536 Montclair, San Diego, CA 92104
Property Description
AMAZINGLY RARE OPPORTUNITY to own one of the few double lots in North Park with over 8,000 sq. ft. of completely buildable land. Lot dimensions have been hand measured twice. With a beautiful & historical 2 bedroom 1 bath home built in 1937, it is eager to be developed, with another 90+ feet of land behind the current home. Too many of these large lots, like the one down the street that just sold, have land that is worthless going down a slope. And this has a city alley behind the property that is accessed from Maple St. Located in a quiet residential neighborhood away from the noisy and high traffic area of the numbered streets. The property is being sold “as is, as disclosed.” Anything known that needs attention will be provided to you in writing.
Features & Amenities
Property Details
Mortgage Calculator
Current Rates
About North Park
This property is located in North Park, a community in San Diego. Explore more listings in this neighborhood to compare options and pricing.
View North Park ListingsComparative Market Analysis
Affordable Tier · 5 active · 5 closed
North Park · San Diego · Single Family Residence
Listed 4.3% above the median closed sale of $1,150,000. Price per sqft ($1,403) is a 19% premium to closed comps ($1,183).
Price Position
Aligned with the market — fair pricing for the comps.
Active Properties (5)
Active Comparables
| Address | City | Year | BD | BTH | SqFt | LotSz | LP/SqFt | LP | DIM | Score |
|---|---|---|---|---|---|---|---|---|---|---|
| 2164 Boundary Street | San Diego | 1964 | 3 | 2 | 1,174 | 7,100 | $1,107 | $1.30M | 16 | 65 |
| 3927 Bancroft Street | San Diego | 1935 | 3 | 2 | 1,250 | 4,134 | $879 | $1.10M | 17 | 63 |
| 3606 FLORIDA ST | San Diego | 1926 | 3 | 2 | 1,085 | 3,024 | $1,159 | $1.26M | 17 | 59 |
| 3587 Marlborough Avenue | San Diego | 1924 | 5 | 3 | 1,700 | 6,753 | $706 | $1.20M | 3 | 44 |
| 2971 Imperial Avenue | San Diego | — | 3 | 3 | 1,775 | 5,583 | $608 | $1.08M | 23 | 40 |
| Total: 5 · Average | 3.4 | 2.4 | 1,396.8 | 5,318.8 | $891.8 | $1.19M | 15.2 | |||
| Median | 1,250 | $1.20M | ||||||||
Closed Properties (5)
Closed Comparables
| Address | City | Year | Date | BD | BTH | SqFt | LotSz | LP | SP | SP/SqFt | SP/LP | DIM | Score |
|---|---|---|---|---|---|---|---|---|---|---|---|---|---|
| 3129 Redwood Street | San Diego | 1960 | 01/14/2026 | 2 | 2 | 978 | 6,400 | $1.20M | $1.15M | $1,176 | 0.96 | 131 | 67 |
| 3274 Redwood Street | San Diego | 1943 | 12/23/2025 | 3 | 2 | 1,021 | 2,073 | $1.27M | $1.27M | $1,249 | 1.00 | 35 | 65 |
| 4208 34th St | San Diego | 1925 | 09/01/2026 | 3 | 2 | 1,118 | 4,754 | $1.05M | $1.05M | $938 | 1.00 | 67 | 60 |
| 2227 Wightman Street | San Diego | 1926 | 02/27/2026 | 3 | 2 | 878 | 3,920 | $1.10M | $1.15M | $1,310 | 1.04 | 35 | 60 |
| 4510 Marlborough Drive | San Diego | 1925 | 11/26/2025 | 2 | 2 | 900 | 2,614 | $1.15M | $1.12M | $1,241 | 0.97 | 64 | 59 |
| Total: 5 · Average | 2.6 | 2.0 | 979 | 3,952.2 | $1.15M | $1.15M | $1,182.8 | — | 66.4 | ||||
| Median | 978 | $1.15M | $1.15M | ||||||||||
Market Analysis
List vs Sale $/SqFt
Sale Price Trend
Days on Market
Sale vs List Price
This analysis was generated automatically from MLS data. For an in-depth, human-reviewed valuation, contact Joseph Sardella at josephsardella@gmail.com.