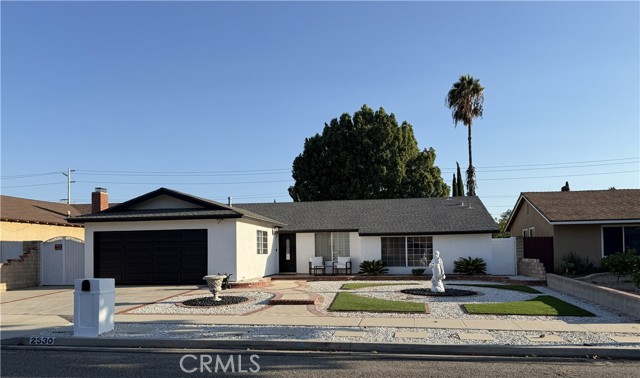
2530 East Alden, Simi Valley, CA 93065
2530 East Alden, Simi Valley, CA 93065
Property Description
Welcome to this beautifully updated single-story home in Simi Valley featuring 4 bedrooms and 2 bathrooms with approximately 1,729 square feet of living space. The home offers an upgraded kitchen, updated flooring, and a comfortable, functional floor plan with spacious living areas. Enjoy a private backyard with plenty of space for relaxing and entertaining. Conveniently located near shopping, dining, schools, parks, and neighborhood amenities. A wonderful opportunity to own a move-in ready home in a desirable Simi Valley neighborhood.
Features & Amenities
Property Details
Mortgage Calculator
Current Rates
Comparative Market Analysis
Residential Tier · 5 active · 5 closed
Simi Valley · Single Family Residence
Listed 10.3% above the median closed sale of $859,999. Closed comps sold at 101% of list — strong seller's market.
Price Position
Positioned above the market — commands a premium.
Active Properties (5)
Active Comparables
| Address | City | Year | BD | BTH | SqFt | LotSz | LP/SqFt | LP | DIM | Score |
|---|---|---|---|---|---|---|---|---|---|---|
| 2481 Alden Street | Simi Valley | 1968 | 4 | 2 | 1,926 | 6,500 | $444 | $854,900 | 32 | 93 |
| 2188 Fernview Street | Simi Valley | 1968 | 3 | 2 | 1,712 | 6,098 | $490 | $839,000 | 111 | 89 |
| 2106 Fernwood Court | Simi Valley | 1968 | 3 | 2 | 1,668 | 6,500 | $498 | $830,000 | 20 | 88 |
| 2482 Gayle Place | Simi Valley | 1968 | 3 | 2 | 1,926 | 6,098 | $436 | $840,000 | 51 | 87 |
| 2526 Glenhurst Court | Simi Valley | 1984 | 4 | 3 | 2,051 | 6,098 | $463 | $949,999 | 41 | 79 |
| Total: 5 · Average | 3.4 | 2.2 | 1,856.6 | 6,258.8 | $466.2 | $862,779.8 | 51 | |||
| Median | 1,926 | $840,000 | ||||||||
Closed Properties (5)
Closed Comparables
| Address | City | Year | Date | BD | BTH | SqFt | LotSz | LP | SP | SP/SqFt | SP/LP | DIM | Score |
|---|---|---|---|---|---|---|---|---|---|---|---|---|---|
| 2490 Alden Street | Simi Valley | 1968 | 10/26/2026 | 4 | 2 | 1,926 | 6,098 | $849,000 | $839,000 | $436 | 0.99 | 52 | 95 |
| 2517 Phyllis Street | Simi Valley | 1968 | 06/20/2026 | 4 | 2 | 1,806 | 6,098 | $859,999 | $859,999 | $476 | 1.00 | 43 | 94 |
| 2467 Marisa | Simi Valley | 1968 | 08/13/2026 | 4 | 2 | 1,729 | 6,098 | $840,000 | $850,000 | $492 | 1.01 | 36 | 92 |
| 2133 Cochran | Simi Valley | 1968 | 04/24/2026 | 3 | 2 | 1,650 | 6,534 | $849,950 | $890,000 | $539 | 1.05 | 52 | 87 |
| 2730 Niles St. | Simi Valley | 1964 | 12/03/2025 | 4 | 2 | 1,590 | 6,969 | $899,000 | $890,000 | $560 | 0.99 | 82 | 85 |
| Total: 5 · Average | 3.8 | 2.0 | 1,740.2 | 6,359.4 | $865,799.8 | $865,799.8 | $500.6 | — | 53 | ||||
| Median | 1,729 | $859,999 | $859,999 | ||||||||||
Market Analysis
List vs Sale $/SqFt
Sale Price Trend
Days on Market
Sale vs List Price
This analysis was generated automatically from MLS data. For an in-depth, human-reviewed valuation, contact Joseph Sardella at josephsardella@gmail.com.