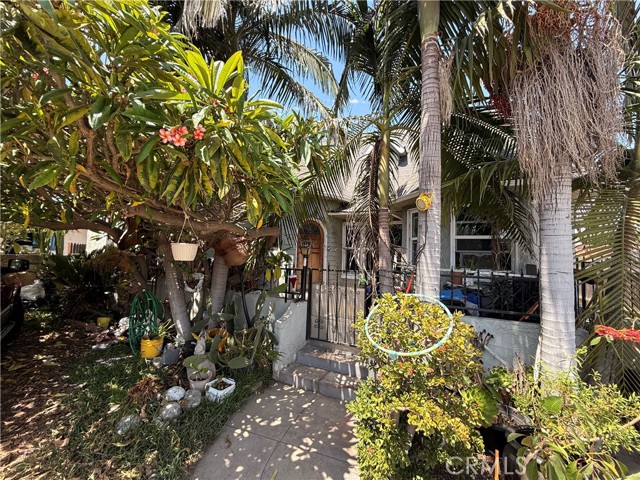
1 / 5
2527 Flower Street, Huntington Park, CA 90255
$800K3bd · 1ba · 1,511 sqft
Lot 6,042 sqft•Single Family Residence•Active•69d on market•MLS# IV-26187559
2527 Flower Street, Huntington Park, CA 90255
MLS# IV-26187559•Residential•Single Family Residence
Active69 days on market
$799,900
3
Beds
1
Baths
1,511
Sq Ft
6,042
Lot Sq Ft
1928
Year Built
None
View
Features & Amenities
FeeBuilt 1928
Property Details
Land Type
Fee
Year Built
1928
Property Type
Residential
Property Subtype
Single Family Residence
Parking Spaces
0
Garage Spaces
0
Heating
None
Cooling
None
View
None
City
Huntington Park
Zip Code
90255
County
Los Angeles
Mortgage Calculator
Current Rates
$
$
%
Monthly Payment
$4,044.73
Principal & Interest
Loan Amount
$639,920
Total Interest
$816,183
Total Payment Over 30 Years
$1,456,103
This calculator provides estimates only. Actual mortgage payments may include taxes, insurance, HOA fees, and PMI. Contact a lender for accurate quotes.
Comparative Market Analysis
Residential Tier · 5 active · 5 closed
2527 Flower Street, Huntington Park, CA 90255
Huntington Park · Single Family Residence
$800K
Residential TierBeds
3
Baths
1
Sqft
1,511
Lot
6,042 sqft
Year
1928
$/Sqft
$529
Pool: No✓
View: None✓
Listed 10.3% above the median closed sale of $725,000. Price per sqft ($529) is a 10% discount to closed comps ($591). Closed comps sold at 103% of list — strong seller's market.
Price Position
Positioned above the market — commands a premium.
Premium
Subject listed at $800K· $529/sqft
Total list price
Closed comps
vs closed median $725K
+$75K (+10.3%)
Active comps
vs active median $750K
+$50K (+6.7%)
Price per sqft
Closed compsinsufficient comp data
Active comps
vs active avg $/sqft $557
−$28 (−5.0%)
Active Properties (5)
Active Comparables
| Address | City | Year | BD | BTH | SqFt | LotSz | LP/SqFt | LP | DIM | Score |
|---|---|---|---|---|---|---|---|---|---|---|
| 3425 Walnut | Huntington Park | 1927 | 3 | 2 | 1,338 | 6,130 | $570 | $763,000 | 81 | 82 |
| 6612 Plaska Ave | Huntington Park | 1938 | 3 | 1 | 1,744 | 5,656 | $430 | $750,000 | 149 | 81 |
| 9111 Bandera Street | Los Angeles | 1929 | 4 | 2 | 1,454 | 5,720 | $474 | $689,000 | 87 | 79 |
| 2837 Kansas | South Gate | 1930 | 3 | 2 | 1,254 | 5,368 | $638 | $799,900 | 41 | 77 |
| 8628 San Juan Avenue | South Gate | 1926 | 3 | 1 | 1,072 | 6,013 | $672 | $720,000 | 18 | 77 |
| Total: 5 · Average | 3.2 | 1.6 | 1,372.4 | 5,777.4 | $556.8 | $744,380 | 75.2 | |||
| Median | 1,338 | $750,000 | ||||||||
Closed Properties (5)
Closed Comparables
| Address | City | Year | Date | BD | BTH | SqFt | LotSz | LP | SP | SP/SqFt | SP/LP | DIM | Score |
|---|---|---|---|---|---|---|---|---|---|---|---|---|---|
| 3152 Olive Street | Huntington Park | 1927 | 12/05/2025 | 3 | 1 | 1,386 | 5,975 | $690,000 | $725,000 | $523 | 1.05 | 72 | 85 |
| 2912 Hill | Huntington Park | 1923 | 06/11/2026 | 3 | 1 | 1,072 | 5,994 | $699,000 | $710,000 | $662 | 1.02 | 35 | 84 |
| 2930 Live Oak | Huntington Park | 1923 | 12/11/2025 | 3 | 2 | 1,412 | 5,986 | $725,000 | $785,000 | $556 | 1.08 | 57 | 84 |
| 2833 Hill Street | Huntington Park | 1922 | 07/24/2026 | 4 | 2 | 1,292 | 5,986 | $785,000 | $800,000 | $619 | 1.02 | 30 | 84 |
| 2742 Olive Street | Huntington Park | 1922 | 12/10/2025 | 3 | 1 | 1,148 | 6,014 | $684,900 | $684,900 | $597 | 1.00 | 400 | 84 |
| Total: 5 · Average | 3.2 | 1.4 | 1,262 | 5,991 | $740,980 | $740,980 | $591.4 | — | 118.8 | ||||
| Median | 1,292 | $725,000 | $725,000 | ||||||||||
Market Analysis
List vs Sale $/SqFt
Sale Price Trend
Days on Market
Sale vs List Price
AI-generated CMA
This analysis was generated automatically from MLS data. For an in-depth, human-reviewed valuation, contact Joseph Sardella at josephsardella@gmail.com.