1 / 19
2515 North Cottonwood, Orange, CA 92865
$1.18M4bd · 2ba · 1,613 sqft
Lot 7,400 sqft•Single Family Residence•Active•144d on market•MLS# PW-26127855
2515 North Cottonwood, Orange, CA 92865
MLS# PW-26127855•Residential•Single Family Residence
Active144 days on market
$1,179,000
4
Beds
2
Baths
1,613
Sq Ft
7,400
Lot Sq Ft
1963
Year Built
None
View
Property Description
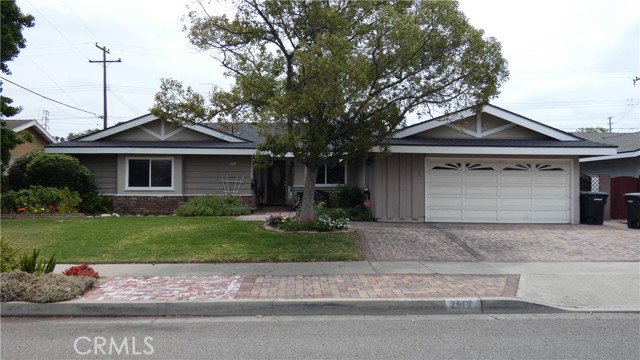
Come and see this fantastic four bedroom home with Villa Park Schools. Paid for solar, updated bathrooms, Pool and Spa with new windows and paver driveway. This home has everything you could wish for.
Features & Amenities
FeeBuilt 1963
Property Details
Land Type
Fee
Year Built
1963
Property Type
Residential
Property Subtype
Single Family Residence
Parking Spaces
2
Garage Spaces
2
Heating
Forced Air
Cooling
Central Air
View
None
Flooring
Carpet, Wood
Roof
Composition
City
Orange
Zip Code
92865
County
Orange
Mortgage Calculator
Current Rates
$
$
%
Monthly Payment
$5,961.67
Principal & Interest
Loan Amount
$943,200
Total Interest
$1,203,000
Total Payment Over 30 Years
$2,146,200
This calculator provides estimates only. Actual mortgage payments may include taxes, insurance, HOA fees, and PMI. Contact a lender for accurate quotes.
Comparative Market Analysis
Residential Tier · 5 active · 5 closed
2515 North Cottonwood, Orange, CA 92865
Orange · Single Family Residence
$1.18M
Residential TierBeds
4
Baths
2
Sqft
1,613
Lot
7,400 sqft
Year
1963
$/Sqft
$731
Pool: Yes✓
Spa: Yes✓
View: None✓
Garage: 2-car✓
Listed 8.2% above the median closed sale of $1,090,000.
Price Position
Positioned above the market — commands a premium.
Premium
Subject listed at $1.18M· $731/sqft
Total list price
Closed comps
vs closed median $1.09M
+$89K (+8.2%)
Active comps
vs active median $1.22M
−$46K (−3.7%)
Price per sqft
Closed compsinsufficient comp data
Active comps
vs active avg $/sqft $675
+$56 (+8.3%)
Active Properties (5)
Active Comparables
| Address | City | Year | BD | BTH | SqFt | LotSz | LP/SqFt | LP | DIM | Score |
|---|---|---|---|---|---|---|---|---|---|---|
| 325 Woodvale Avenue | Orange | 1963 | 4 | 2 | 1,938 | 7,296 | $568 | $1.10M | 53 | 94 |
| 1017 Grove | Orange | 1963 | 4 | 2 | 1,827 | 8,000 | $700 | $1.28M | 5 | 90 |
| 144 Greenway Avenue | Orange | 1963 | 4 | 2 | 1,566 | 7,100 | $782 | $1.22M | 11 | 86 |
| 2129 Pine | Orange | 1963 | 4 | 4 | 1,913 | 8,000 | $706 | $1.35M | 130 | 85 |
| 840 Glendora Avenue | Orange | 1962 | 4 | 2 | 1,862 | 8,400 | $618 | $1.15M | 29 | 81 |
| Total: 5 · Average | 4.0 | 2.4 | 1,821.2 | 7,759.2 | $674.8 | $1.22M | 45.6 | |||
| Median | 1,862 | $1.22M | ||||||||
Closed Properties (5)
Closed Comparables
| Address | City | Year | Date | BD | BTH | SqFt | LotSz | LP | SP | SP/SqFt | SP/LP | DIM | Score |
|---|---|---|---|---|---|---|---|---|---|---|---|---|---|
| 2496 Beechwood Street | Orange | 1963 | 04/10/2026 | 3 | 2 | 1,463 | 8,100 | $1.19M | $1.17M | $796 | 0.98 | 131 | 86 |
| 564 Fellows | Orange | 1963 | 12/05/2025 | 4 | 2 | 1,637 | 11,780 | $1.30M | $1.25M | $764 | 0.96 | 29 | 85 |
| 1102 E. Amber Avenue | Orange | 1962 | 10/23/2026 | 3 | 2 | 1,860 | 8,000 | $1.10M | $1.09M | $586 | 0.99 | 22 | 85 |
| 2620 Dunbar Street | Orange | 1960 | 06/18/2026 | 3 | 2 | 1,500 | 9,682 | $1.17M | $1.06M | $707 | 0.91 | 140 | 81 |
| 2679 Glenside | Orange | 1963 | 11/13/2025 | 4 | 2 | 1,559 | 8,030 | $999,000 | $1.09M | $699 | 1.09 | 30 | 80 |
| Total: 5 · Average | 3.4 | 2.0 | 1,603.8 | 9,118.4 | $1.13M | $1.13M | $710.4 | — | 70.4 | ||||
| Median | 1,559 | $1.09M | $1.09M | ||||||||||
Market Analysis
List vs Sale $/SqFt
Sale Price Trend
Days on Market
Sale vs List Price
AI-generated CMA
This analysis was generated automatically from MLS data. For an in-depth, human-reviewed valuation, contact Joseph Sardella at josephsardella@gmail.com.