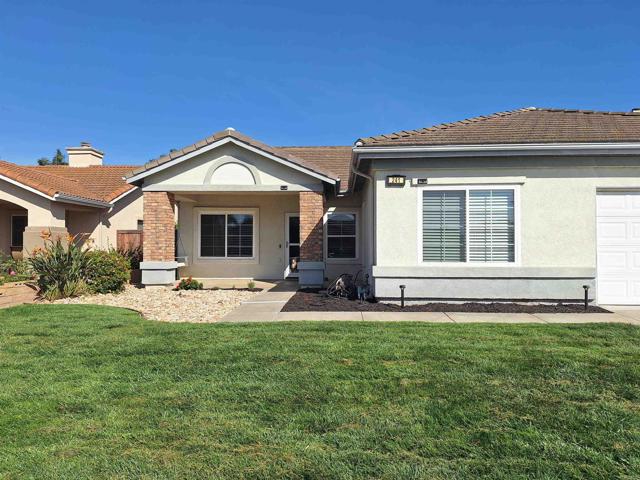
241 Del Mesa Street, Oceanside, CA 92058
241 Del Mesa Street, Oceanside, CA 92058
Property Description
HUGE PRICE REDUCTION. You are not going to find a home this large with Solar Panels and beautifully maintained at this price. Welcome to 241 Del Mesa Street. This beautiful single story home is ready for its new owners. 2067 sq feet of easy living. Double pane windows, laminate flooring in main living areas and carpet in the bedrooms. This home also has Solar which is approximately 6 years old. The solar is owned. HVAC is also approximately 6 years old. Enter into a formal living room and dining. The kitchen features upgraded oven, stove & dishwasher (Bosch) all less than two years old. Granite countertops, and Island. Kitchen overlooks the family room with gas fireplace. The sliding glass doors off the kitchen lead you to a low maintenance back yard. Master bedroom suite has double doors, vaulted ceiling and oversized walk in closet. This home also offers two additional bedrooms and an office Home is located near several parks, Camp Pendleton, shopping and public transportation. Easy access to the beach and freeway.
Features & Amenities
Property Details
Mortgage Calculator
Current Rates
Comparative Market Analysis
Residential Tier · 5 active · 5 closed
Oceanside · Single Family Residence
Listed 4.0% above the median closed sale of $880,000. Closed comps sold at 100% of list — strong seller's market.
Price Position
Aligned with the market — fair pricing for the comps.
Active Properties (5)
Active Comparables
| Address | City | Year | BD | BTH | SqFt | LotSz | LP/SqFt | LP | DIM | Score |
|---|---|---|---|---|---|---|---|---|---|---|
| 4499 Pebble Beach Drive | Oceanside | 1989 | 4 | 3 | 2,002 | 6,398 | $444 | $889,000 | 90 | 83 |
| 327 Alamo Way | Oceanside | 2003 | 4 | 3 | 2,291 | 4,555 | $392 | $899,000 | 52 | 81 |
| 316 Spring Canyon Way | Oceanside | 2003 | 4 | 3 | 2,364 | 4,271 | $406 | $960,000 | 30 | 79 |
| 4593 Mardi Gras | Oceanside | 1980 | 4 | 3 | 1,666 | 6,042 | $522 | $870,000 | 62 | 78 |
| 4126 Mission Tree Way | Oceanside | 2018 | 4 | 4 | 2,157 | 262,977 | $408 | $880,000 | 37 | 78 |
| Total: 5 · Average | 4.0 | 3.2 | 2,096 | 56,848.6 | $434.4 | $899,600 | 54.2 | |||
| Median | 2,157 | $889,000 | ||||||||
Closed Properties (5)
Closed Comparables
| Address | City | Year | Date | BD | BTH | SqFt | LotSz | LP | SP | SP/SqFt | SP/LP | DIM | Score |
|---|---|---|---|---|---|---|---|---|---|---|---|---|---|
| 359 Franciscan Way | Oceanside | 2004 | 08/20/2026 | 4 | 3 | 2,168 | 3,485 | $875,000 | $880,000 | $406 | 1.01 | 57 | 86 |
| 3991 Galante Way | Oceanside | 2004 | 09/23/2026 | 4 | 3 | 2,204 | 3,575 | $885,000 | $875,000 | $397 | 0.99 | 96 | 86 |
| 3672 Cypress | Oceanside | 2005 | 04/23/2026 | 4 | 2 | 2,463 | 12,329 | $1.00M | $1.01M | $410 | 1.01 | 56 | 84 |
| 332 Del Flora | Oceanside | 1999 | 02/03/2026 | 3 | 2 | 1,322 | 6,570 | $799,900 | $805,000 | $609 | 1.01 | 49 | 83 |
| 726 Fredricks Avenue | Oceanside | 1979 | 04/22/2026 | 4 | 2 | 1,863 | 6,098 | $920,000 | $930,000 | $499 | 1.01 | 33 | 82 |
| Total: 5 · Average | 3.8 | 2.4 | 2,004 | 6,411.4 | $900,000 | $900,000 | $464.2 | — | 58.2 | ||||
| Median | 2,168 | $880,000 | $880,000 | ||||||||||
Market Analysis
List vs Sale $/SqFt
Sale Price Trend
Days on Market
Sale vs List Price
This analysis was generated automatically from MLS data. For an in-depth, human-reviewed valuation, contact Joseph Sardella at josephsardella@gmail.com.