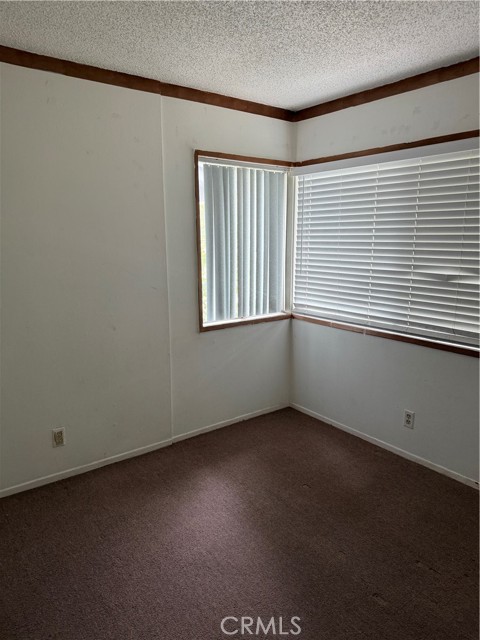
1 / 8
23571 Maribel, Carson, CA 90745
$419K2bd · 2ba · 736 sqft
Lot 462,652 sqft•HOA $350/mo•Condominium•Active•160d on market•MLS# IN-26106959
23571 Maribel, Carson, CA 90745
MLS# IN-26106959•Residential•Condominium
Active160 days on market
$419,000
2
Beds
2
Baths
736
Sq Ft
462,652
Lot Sq Ft
$350
HOA/mo
1944
Year Built
None
View
Property Description
2 Bedroom 1.5 Ba condominium in Avalon Green 1. Gated community. Low HOA fees of approx $350 includes Water, Trash and Management. The unit has its own detached Garage and and an additional assigned parking space.
Features & Amenities
FeeBuilt 1944
Property Details
Land Type
Fee
Year Built
1944
Property Type
Residential
Property Subtype
Condominium
Parking Spaces
1
Garage Spaces
1
Cooling
Central Air
View
None
City
Carson
Zip Code
90745
County
Los Angeles
Mortgage Calculator
Current Rates
$
$
%
Monthly Payment
$2,118.69
Principal & Interest
Loan Amount
$335,200
Total Interest
$427,529
Total Payment Over 30 Years
$762,729
This calculator provides estimates only. Actual mortgage payments may include taxes, insurance, HOA fees, and PMI. Contact a lender for accurate quotes.
Comparative Market Analysis
Affordable Tier · 5 active · 5 closed
23571 Maribel, Carson, CA 90745
Carson · Condominium
$419K
Affordable TierBeds
2
Baths
2
Sqft
736
Lot
10.62 ac
Year
1944
$/Sqft
$569
Pool: No✓
View: None✓
Garage: 1-car✓
Listed in line with the median closed sale of $425,000. Price per sqft ($569) is a 23% premium to closed comps ($464).
Price Position
Aligned with the market — fair pricing for the comps.
At market
Subject listed at $419K· $569/sqft
Total list price
Closed comps
vs closed median $425K
−$6K (−1.4%)
Active comps
vs active median $450K
−$31K (−6.9%)
Price per sqft
Closed compsinsufficient comp data
Active comps
vs active avg $/sqft $457
+$112 (+24.6%)
Active Properties (5)
Active Comparables
| Address | City | Year | BD | BTH | SqFt | LotSz | LP/SqFt | LP | DIM | Score |
|---|---|---|---|---|---|---|---|---|---|---|
| 443 234th Walk | Carson | 1944 | 2 | 2 | 700 | 434,960 | $643 | $450,000 | 16 | 97 |
| 23271 Maribel | Carson | 1944 | 2 | 2 | 700 | 444,201 | $643 | $449,900 | 8 | 97 |
| 17 Scottsdale | Carson | 1963 | 3 | 2 | 1,091 | 1,905,404 | $365 | $398,000 | 154 | 70 |
| 13 Paradise | Carson | 1963 | 4 | 2 | 1,421 | 1,905,404 | $303 | $429,900 | 3 | 59 |
| 1 Dovecote | Carson | 1963 | 4 | 2 | 1,421 | 1,905,404 | $330 | $469,000 | 55 | 58 |
| Total: 5 · Average | 3.0 | 2.0 | 1,066.6 | 1,319,074.6 | $456.8 | $439,360 | 47.2 | |||
| Median | 1,091 | $449,900 | ||||||||
Closed Properties (5)
Closed Comparables
| Address | City | Year | Date | BD | BTH | SqFt | LotSz | LP | SP | SP/SqFt | SP/LP | DIM | Score |
|---|---|---|---|---|---|---|---|---|---|---|---|---|---|
| 23334 Sesame | Torrance | 1973 | 06/29/2026 | 2 | 2 | 829 | 296,241 | $429,999 | $430,000 | $519 | 1.00 | 67 | 76 |
| 806 Coriander | Torrance | 1973 | 08/04/2026 | 2 | 2 | 829 | 296,241 | $444,999 | $425,000 | $513 | 0.95 | 133 | 75 |
| 23318 Sesame Street | Torrance | 1973 | 07/29/2026 | 2 | 2 | 829 | 296,241 | $464,000 | $462,000 | $557 | 1.00 | 64 | 72 |
| 30 Camelback | Carson | 1963 | 07/30/2026 | 3 | 2 | 1,091 | 1,905,404 | $379,000 | $401,000 | $368 | 1.06 | 59 | 71 |
| 48 Paradise | Carson | 1963 | 07/29/2026 | 3 | 2 | 1,111 | 1,905,404 | $424,900 | $405,000 | $365 | 0.95 | 57 | 70 |
| Total: 5 · Average | 2.4 | 2.0 | 937.8 | 939,906.2 | $424,600 | $424,600 | $464.4 | — | 76 | ||||
| Median | 829 | $425,000 | $425,000 | ||||||||||
Market Analysis
List vs Sale $/SqFt
Sale Price Trend
Days on Market
Sale vs List Price
AI-generated CMA
This analysis was generated automatically from MLS data. For an in-depth, human-reviewed valuation, contact Joseph Sardella at josephsardella@gmail.com.