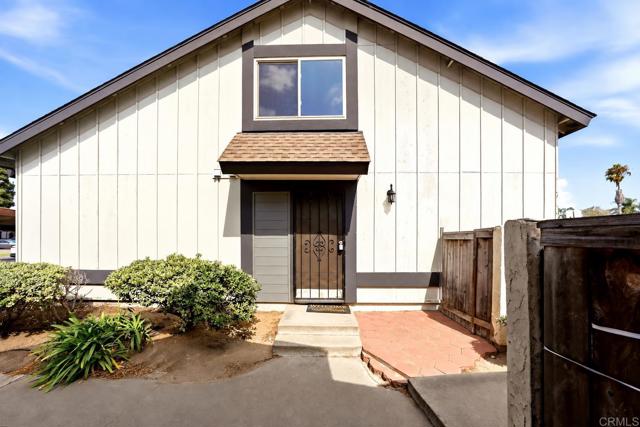
2332 Tocayo Avenue, 59, San Diego, CA 92154
2332 Tocayo Avenue, 59, San Diego, CA 92154
Property Description
Spacious 3-bedroom, 2-bath condo offering 1,224 square feet of comfortable living space with the added feel and privacy of a single-family home. The functional floor plan features a bright and inviting living area, dedicated dining space, generously sized bedrooms, and convenient in-unit laundry. Step outside to your own private yard, offering additional space to relax, entertain, or enjoy the outdoors. The property also includes two garage parking spots. With plenty of opportunity to personalize and make it your own, this home is a great option for a variety of buyers. Conveniently located near shopping, dining, schools, parks, public transportation, and freeway access, offering everyday comfort and convenience.
Features & Amenities
Property Details
Mortgage Calculator
Current Rates
Comparative Market Analysis
Affordable Tier · 5 active · 5 closed
San Diego · Condominium
Listed 5.0% below the median closed sale of $500,000. Price per sqft ($388) is a 11% discount to closed comps ($434).
Price Position
Priced below the market — value advantage over the field.
Active Properties (5)
Active Comparables
| Address | City | Year | BD | BTH | SqFt | LotSz | LP/SqFt | LP | DIM | Score |
|---|---|---|---|---|---|---|---|---|---|---|
| 1570 Monterey Pine Drive | San Ysidro | 1978 | 3 | 2 | 978 | 106,286 | $486 | $475,000 | 47 | 87 |
| 3576 Del Sol Blvd | San Diego | 1974 | 3 | 2 | 1,020 | 0 | $417 | $425,000 | 23 | 78 |
| 3156 Caminito Quixote | San Diego | 1974 | 2 | 2 | 966 | 0 | $442 | $426,995 | 12 | 76 |
| 1472 Iris Avenue | Imperial Beach | 1972 | 2 | 1 | 800 | 0 | $569 | $454,999 | 67 | 69 |
| 1340 Holly Avenue | Imperial Beach | 1979 | 2 | 1 | 800 | 23,958 | $550 | $439,999 | 118 | 68 |
| Total: 5 · Average | 2.4 | 1.6 | 912.8 | 65,122 | $492.8 | $444,398.6 | 53.4 | |||
| Median | 966 | $439,999 | ||||||||
Closed Properties (5)
Closed Comparables
| Address | City | Year | Date | BD | BTH | SqFt | LotSz | LP | SP | SP/SqFt | SP/LP | DIM | Score |
|---|---|---|---|---|---|---|---|---|---|---|---|---|---|
| 2424 Tocayo Avenue | San Diego | 1979 | 08/28/2026 | 3 | 2 | 1,224 | 142,441 | $499,999 | $500,000 | $408 | 1.00 | 23 | 95 |
| 1316 San Ysidro | San Ysidro | 1985 | 09/18/2026 | 3 | 2 | 1,184 | 154,825 | $555,000 | $535,000 | $452 | 0.96 | 30 | 89 |
| 1570 ORO VISTA Road | San Diego | 1980 | 01/06/2026 | 3 | 3 | 1,222 | 0 | $485,000 | $490,000 | $401 | 1.01 | 87 | 84 |
| 1560 Monterey Pine Drive | San Ysidro | 1978 | 02/06/2026 | 3 | 2 | 1,134 | 0 | $525,000 | $535,000 | $472 | 1.02 | 73 | 83 |
| 1241 Hollister Street | San Diego | 1980 | 12/26/2025 | 2 | 2 | 1,116 | 1 | $485,000 | $485,000 | $435 | 1.00 | 39 | 81 |
| Total: 5 · Average | 2.8 | 2.2 | 1,176 | 99,089 | $509,000 | $509,000 | $433.6 | — | 50.4 | ||||
| Median | 1,184 | $500,000 | $500,000 | ||||||||||
Market Analysis
List vs Sale $/SqFt
Sale Price Trend
Days on Market
Sale vs List Price
This analysis was generated automatically from MLS data. For an in-depth, human-reviewed valuation, contact Joseph Sardella at josephsardella@gmail.com.