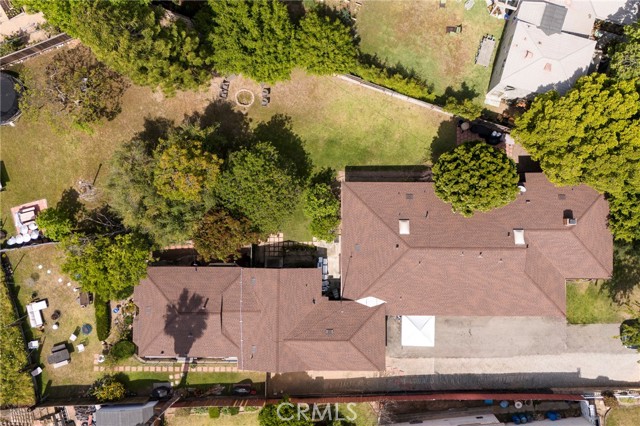
23211 Doris, Torrance, CA 90505
23211 Doris, Torrance, CA 90505
Property Description
Exceptional Development Opportunity in Prime South Torrance! Over Half an Acre (.56 Acres) Rarely does a parcel of this size become available in such a sought-after South Torrance location. Situated on an expansive ~24,000+ sq ft lot, this property presents a unique opportunity for developers, investors, or end-users looking to build, expand, or reimagine. The generous lot size offers significant potential for redevelopment (buyer to verify with the City of Torrance), whether exploring subdivision, new construction, or creating a custom estate. Surrounded by established homes and located on a quiet residential street, the setting combines scale, privacy, and long-term upside. Ideally positioned near award-winning Torrance schools, parks, shopping, dining, and just a short drive to the beach, this is a rare chance to secure a large parcel in one of the South Bay’s most desirable neighborhoods.
Features & Amenities
Property Details
Mortgage Calculator
Current Rates
Comparative Market Analysis
Luxury Tier · 5 active · 5 closed
Torrance · Single Family Residence
Listed 12.2% above the median closed sale of $2,625,000. Price per sqft ($1,125) is a 12% premium to closed comps ($1,000). Luxury tier — fewer comparable sales widen the confidence range.
Price Position
Positioned above the market — commands a premium.
Active Properties (5)
Active Comparables
| Address | City | Year | BD | BTH | SqFt | LotSz | LP/SqFt | LP | DIM | Score |
|---|---|---|---|---|---|---|---|---|---|---|
| 5013 Macafee Road | Torrance | 2025 | 5 | 5 | 2,618 | 6,037 | $1,220 | $3.19M | 628 | 65 |
| 709 Via Del Monte | Palos Verdes Estates | 1966 | 3 | 3 | 2,668 | 8,347 | $1,143 | $3.05M | 54 | 59 |
| 412 Miramar Drive | Redondo Beach | 1990 | 4 | 4 | 2,795 | 3,189 | $948 | $2.65M | 57 | 59 |
| 5030 Rolling Meadows Road | Rolling Hills Estates | 1955 | 5 | 4 | 3,117 | 14,041 | $882 | $2.75M | 40 | 55 |
| 4057 Via Pavion | Palos Verdes Estates | 1956 | 3 | 3 | 2,209 | 11,475 | $1,213 | $2.68M | 38 | 52 |
| Total: 5 · Average | 4.0 | 3.8 | 2,681.4 | 8,617.8 | $1,081.2 | $2.86M | 163.4 | |||
| Median | 2,668 | $2.75M | ||||||||
Closed Properties (5)
Closed Comparables
| Address | City | Year | Date | BD | BTH | SqFt | LotSz | LP | SP | SP/SqFt | SP/LP | DIM | Score |
|---|---|---|---|---|---|---|---|---|---|---|---|---|---|
| 316 Paseo De Gracia | Redondo Beach | 1952 | 09/08/2026 | 4 | 5 | 3,129 | 6,474 | $3.25M | $3.10M | $991 | 0.95 | 57 | 75 |
| 224 Avenue G | Redondo Beach | 1949 | 06/09/2026 | 3 | 4 | 2,537 | 6,027 | $2.70M | $2.58M | $1,019 | 0.96 | 95 | 70 |
| 5407 Via Del Valle | Torrance | 1955 | 05/18/2026 | 4 | 4 | 2,847 | 6,954 | $2.65M | $2.63M | $922 | 0.99 | 180 | 70 |
| 438 Calle De Aragon | Redondo Beach | 1948 | 12/02/2025 | 5 | 4 | 2,988 | 6,437 | $2.69M | $2.61M | $873 | 0.97 | 72 | 70 |
| 5519 Calle De Ricardo | Torrance | 1955 | 05/01/2026 | 4 | 3 | 2,320 | 7,811 | $2.90M | $2.77M | $1,193 | 0.95 | 50 | 69 |
| Total: 5 · Average | 4.0 | 4.0 | 2,764.2 | 6,740.6 | $2.74M | $2.74M | $999.6 | — | 90.8 | ||||
| Median | 2,847 | $2.63M | $2.63M | ||||||||||
Market Analysis
List vs Sale $/SqFt
Sale Price Trend
Days on Market
Sale vs List Price
This analysis was generated automatically from MLS data. For an in-depth, human-reviewed valuation, contact Joseph Sardella at josephsardella@gmail.com.