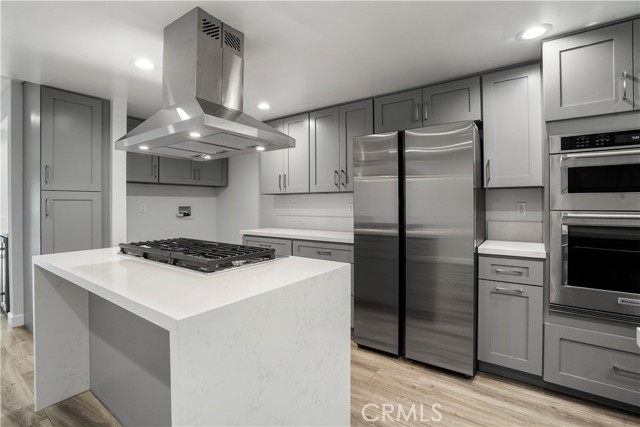
227 East Burbank, C, Burbank, CA 91502
227 East Burbank, C, Burbank, CA 91502
Property Description
Welcome to 227 E Burbank Blvd, Unit C, Burbank, CA 91502—a remodeled condo with permits, offering 1,398 SF of open living space with 2 bedrooms and 2.5 baths. This modern home features a brand-new kitchen with custom cabinets, countertops, and appliances, plus new flooring, HVAC, and double-pane windows & sliding doors. The updated bathrooms and custom-organized closets add both style and function. Enjoy the peace of a small 7-unit HOA community, just minutes from retail, dining, Burbank Mall, Downtown Burbank, top-rated schools, and major studios. Includes 2 secured parking spaces and easy I-5 freeway access. Don’t miss this prime Burbank gem—schedule a tour today!
Features & Amenities
Property Details
Mortgage Calculator
Current Rates
Comparative Market Analysis
Affordable Tier · 5 active · 5 closed
Burbank · Townhouse
Listed 10.7% above the median closed sale of $700,000. Closed comps sold at 100% of list — strong seller's market.
Price Position
Positioned above the market — commands a premium.
Active Properties (5)
Active Comparables
| Address | City | Year | BD | BTH | SqFt | LotSz | LP/SqFt | LP | DIM | Score |
|---|---|---|---|---|---|---|---|---|---|---|
| 528 E. San Jose Ave | Burbank | 1990 | 3 | 3 | 1,321 | 8,957 | $567 | $749,000 | 90 | 82 |
| 722 Orange Grove Avenue | Burbank | 1991 | 3 | 3 | 1,442 | 7,798 | $537 | $775,000 | 101 | 79 |
| 332 N 5th street | Burbank | 1974 | 2 | 2 | 1,281 | 14,839 | $546 | $699,999 | 204 | 78 |
| 9564 Via Bernardo | Burbank | 1977 | 3 | 3 | 1,602 | 327,980 | $421 | $675,000 | 87 | 65 |
| 9659 Via Torino | Burbank | 1975 | 4 | 3 | 1,602 | 228,683 | $531 | $850,000 | 95 | 63 |
| Total: 5 · Average | 3.0 | 2.8 | 1,449.6 | 117,651.4 | $520.4 | $749,799.8 | 115.4 | |||
| Median | 1,442 | $749,000 | ||||||||
Closed Properties (5)
Closed Comparables
| Address | City | Year | Date | BD | BTH | SqFt | LotSz | LP | SP | SP/SqFt | SP/LP | DIM | Score |
|---|---|---|---|---|---|---|---|---|---|---|---|---|---|
| 639 Olive | Burbank | 1977 | 08/28/2026 | 3 | 3 | 1,465 | 7,117 | $699,000 | $700,000 | $478 | 1.00 | 52 | 84 |
| 611 Olive | Burbank | 1992 | 07/16/2026 | 2 | 3 | 1,527 | 7,236 | $799,000 | $795,000 | $521 | 0.99 | 112 | 83 |
| 557 San Jose Avenue | Burbank | 1980 | 06/18/2026 | 2 | 3 | 1,125 | 7,320 | $699,996 | $685,000 | $609 | 0.98 | 57 | 83 |
| 1140 Lamer | Burbank | 1979 | 09/22/2026 | 2 | 3 | 1,071 | 11,196 | $719,800 | $700,000 | $654 | 0.97 | 49 | 78 |
| 1719 Rogers Place | Burbank | 1981 | 05/12/2026 | 2 | 2 | 1,485 | 41,938 | $649,875 | $700,000 | $471 | 1.08 | 26 | 77 |
| Total: 5 · Average | 2.2 | 2.8 | 1,334.6 | 14,961.4 | $716,000 | $716,000 | $546.6 | — | 59.2 | ||||
| Median | 1,465 | $700,000 | $700,000 | ||||||||||
Market Analysis
List vs Sale $/SqFt
Sale Price Trend
Days on Market
Sale vs List Price
This analysis was generated automatically from MLS data. For an in-depth, human-reviewed valuation, contact Joseph Sardella at josephsardella@gmail.com.