22216 South Vermont Avenue, 201B, Torrance, CA 90502
22216 South Vermont Avenue, 201B, Torrance, CA 90502
Property Description
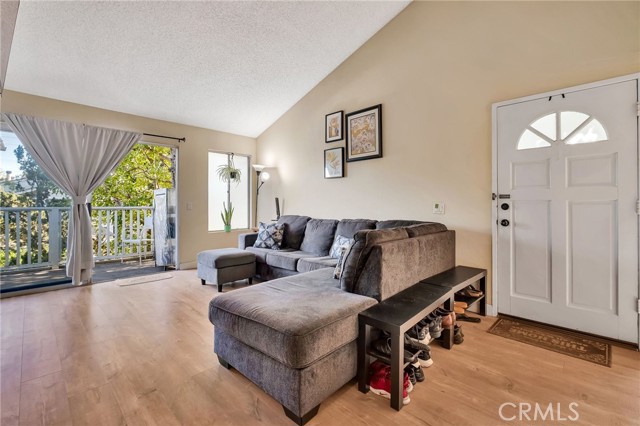
Welcome to this wonderful 2 bedroom 2 baths upper-level condo. Open floor plan with an abundance of natural light and views of the stream and pool off of the living room balcony to enjoy your morning coffee. The living room is appointed with a gas fireplace and laminate floors. The primary suite includes and en suite bathroom and walk in closet with views of the mature landscape. Laundry room with washer and dryer, central air and 2 covered parking spots. Conveniently located near restaurants, shopping and the freeway.
Features & Amenities
Property Details
Mortgage Calculator
Current Rates
Comparative Market Analysis
Affordable Tier · 5 active · 5 closed
Torrance · Condominium
Listed 3.7% below the median closed sale of $462,000. Price per sqft ($463) is a 14% discount to closed comps ($541). Closed comps sold at 100% of list — strong seller's market.
Price Position
Aligned with the market — fair pricing for the comps.
Active Properties (5)
Active Comparables
| Address | City | Year | BD | BTH | SqFt | LotSz | LP/SqFt | LP | DIM | Score |
|---|---|---|---|---|---|---|---|---|---|---|
| 22232 Vermont Avenue | Torrance | 1985 | 2 | 2 | 961 | 181,676 | $519 | $499,000 | 94 | 95 |
| 21846 S Vermont Ave | Torrance | 1998 | 2 | 2 | 944 | 19,269 | $529 | $499,000 | 122 | 84 |
| 23320 Sesame Street | Torrance | 1973 | 2 | 2 | 829 | 296,241 | $531 | $440,000 | 8 | 84 |
| 1432 227th | Torrance | 1984 | 2 | 1 | 865 | 14,411 | $483 | $418,000 | 31 | 83 |
| 23304 Marigold Avenue | Torrance | 1973 | 2 | 2 | 859 | 209,813 | $588 | $505,000 | 41 | 82 |
| Total: 5 · Average | 2.0 | 1.8 | 891.6 | 144,282 | $530 | $472,200 | 59.2 | |||
| Median | 865 | $499,000 | ||||||||
Closed Properties (5)
Closed Comparables
| Address | City | Year | Date | BD | BTH | SqFt | LotSz | LP | SP | SP/SqFt | SP/LP | DIM | Score |
|---|---|---|---|---|---|---|---|---|---|---|---|---|---|
| 23304 Marigold Avenue | Torrance | 1973 | 04/24/2026 | 2 | 2 | 859 | 209,813 | $449,999 | $465,000 | $541 | 1.03 | 63 | 82 |
| 23334 Sesame | Torrance | 1973 | 06/29/2026 | 2 | 2 | 829 | 296,241 | $429,999 | $430,000 | $519 | 1.00 | 67 | 80 |
| 806 Coriander | Torrance | 1973 | 08/04/2026 | 2 | 2 | 829 | 296,241 | $444,999 | $425,000 | $513 | 0.95 | 133 | 79 |
| 23318 Sesame Street | Torrance | 1973 | 07/29/2026 | 2 | 2 | 829 | 296,241 | $464,000 | $462,000 | $557 | 1.00 | 64 | 78 |
| 23230 Sesame | Torrance | 1973 | 11/17/2025 | 2 | 2 | 842 | 309,276 | $475,000 | $485,000 | $576 | 1.02 | 53 | 78 |
| Total: 5 · Average | 2.0 | 2.0 | 837.6 | 281,562.4 | $453,400 | $453,400 | $541.2 | — | 76 | ||||
| Median | 829 | $462,000 | $462,000 | ||||||||||
Market Analysis
List vs Sale $/SqFt
Sale Price Trend
Days on Market
Sale vs List Price
This analysis was generated automatically from MLS data. For an in-depth, human-reviewed valuation, contact Joseph Sardella at josephsardella@gmail.com.