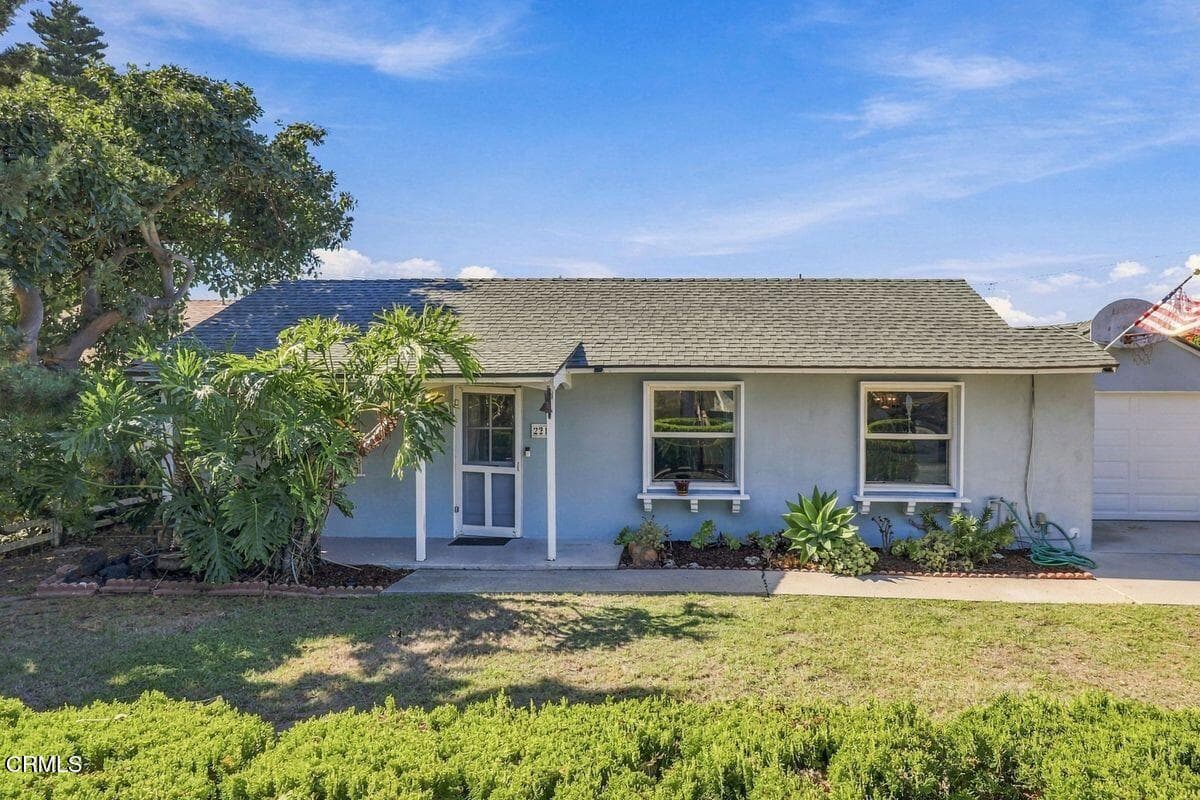
221 South Brent Street, Ventura, CA 93003
221 South Brent Street, Ventura, CA 93003
Property Description
Welcome to 221 S. Brent Street, a charming Midtown Ventura home lovingly cared for by the same family since 1978. This inviting three-bedroom, two-bathroom residence sits on a generous lot of over 7,000 square feet, offering plenty of space and possibilities. Filled with character and warmth, the home presents a wonderful opportunity to make it your own while preserving its timeless charm. Conveniently located in the heart of Midtown Ventura, just minutes from local shops, restaurants, parks, and beautiful beaches, this special property combines a desirable location, a spacious lot, and lots of potential. A rare opportunity to create your own memories in a home that has been cherished for nearly five decades.
Features & Amenities
Property Details
Mortgage Calculator
Current Rates
Comparative Market Analysis
Affordable Tier · 5 active · 5 closed
Ventura · Single Family Residence
Listed in line with the median closed sale of $914,000. Price per sqft ($620) is a 19% discount to closed comps ($763).
Price Position
Aligned with the market — fair pricing for the comps.
Active Properties (5)
Active Comparables
| Address | City | Year | BD | BTH | SqFt | LotSz | LP/SqFt | LP | DIM | Score |
|---|---|---|---|---|---|---|---|---|---|---|
| 3899 Maple Street | Ventura | 1956 | 3 | 2 | 1,587 | 6,648 | $614 | $975,000 | 25 | 87 |
| 3405 Loma Vista Road | Ventura | 1952 | 3 | 2 | 1,832 | 6,534 | $504 | $924,000 | 39 | 86 |
| 2756 Channel Drive | Ventura | 1951 | 2 | 1 | 1,200 | 6,534 | $708 | $849,000 | 50 | 86 |
| 293 Jordan Avenue | Ventura | 1915 | 3 | 2 | 1,537 | 5,401 | $618 | $950,000 | 3 | 82 |
| 586 Schuman Place | Ventura | 1999 | 4 | 3 | 1,834 | 3,484 | $502 | $920,000 | 45 | 59 |
| Total: 5 · Average | 3.0 | 2.0 | 1,598 | 5,720.2 | $589.2 | $923,600 | 32.4 | |||
| Median | 1,587 | $924,000 | ||||||||
Closed Properties (5)
Closed Comparables
| Address | City | Year | Date | BD | BTH | SqFt | LotSz | LP | SP | SP/SqFt | SP/LP | DIM | Score |
|---|---|---|---|---|---|---|---|---|---|---|---|---|---|
| 220 Frances Street | Ventura | 1951 | 12/15/2025 | 3 | 2 | 1,540 | 6,534 | $899,000 | $914,000 | $594 | 1.02 | 41 | 91 |
| 511 Eva Street | Ventura | 1951 | 05/13/2026 | 3 | 1 | 1,222 | 6,098 | $925,000 | $878,250 | $719 | 0.95 | 33 | 87 |
| 472 Dos Caminos Avenue | Ventura | 1953 | 08/14/2026 | 3 | 1 | 1,192 | 6,098 | $979,000 | $969,000 | $813 | 0.99 | 35 | 86 |
| 3131 Armada Drive | Ventura | 1955 | 07/10/2026 | 4 | 2 | 1,293 | 5,700 | $899,000 | $899,000 | $695 | 1.00 | 125 | 85 |
| 331 Eva Street | Ventura | 1951 | 09/17/2026 | 2 | 1 | 964 | 6,534 | $949,000 | $960,000 | $996 | 1.01 | 23 | 84 |
| Total: 5 · Average | 3.0 | 1.4 | 1,242.2 | 6,192.8 | $924,050 | $924,050 | $763.4 | — | 51.4 | ||||
| Median | 1,222 | $914,000 | $914,000 | ||||||||||
Market Analysis
List vs Sale $/SqFt
Sale Price Trend
Days on Market
Sale vs List Price
This analysis was generated automatically from MLS data. For an in-depth, human-reviewed valuation, contact Joseph Sardella at josephsardella@gmail.com.