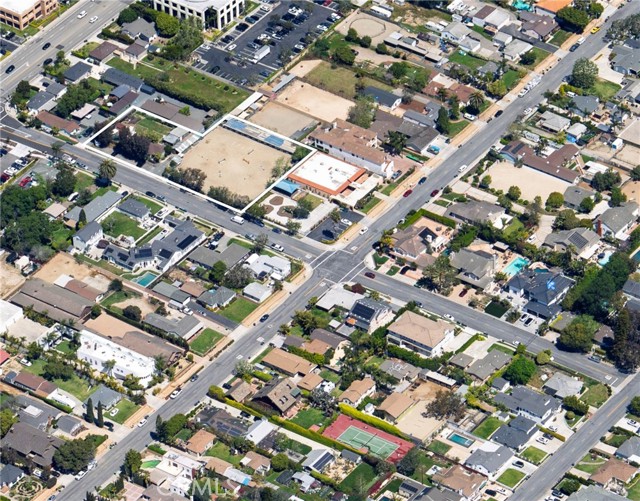
2173 Orchard Drive, Newport Beach, CA 92660
2173 Orchard Drive, Newport Beach, CA 92660
Property Description
For the first time in over 80 years, 2173 Orchard is available for purchase—a rare opportunity to own a landmark estate in Newport Beach’s only equestrian neighborhood. Spanning an expansive 37,950-square-foot flat lot, this is the largest parcel currently for sale in Newport Beach. The property features a modest home alongside a fully operational equestrian stable, accommodating 8 to 11 horses, with direct access to scenic trails that wind through miles of Newport Beach’s Back Bay. As part of this exclusive community, residents enjoy picturesque views of horses during morning strolls and seamless access to the Back Bay Nature Preserve, offering stunning trails for walking and biking. This is truly a once-in-a-lifetime opportunity.
Features & Amenities
Property Details
Mortgage Calculator
Current Rates
Comparative Market Analysis
Luxury Tier · 5 active · 5 closed
Newport Beach · Single Family Residence
Listed in line with the median closed sale of $8,750,000. Price per sqft ($9,651) is a 442% premium to closed comps ($1,780). Expect a longer timeline — comps averaged 120 days on market. Luxury tier — fewer comparable sales widen the confidence range.
Price Position
Aligned with the market — fair pricing for the comps.
Active Properties (5)
Active Comparables
| Address | City | Year | BD | BTH | SqFt | LotSz | LP/SqFt | LP | DIM | Score |
|---|---|---|---|---|---|---|---|---|---|---|
| 2118 Leeward | Newport Beach | 1964 | 5 | 4 | 4,200 | 8,400 | $2,261 | $9.49M | 31 | 40 |
| 1534 Santiago | Newport Beach | 1967 | 3 | 4 | 2,903 | 10,179 | $3,099 | $8.99M | 136 | 27 |
| 1100 Polaris Drive | Newport Beach | 1964 | 3 | 4 | 3,348 | 6,900 | $2,927 | $9.80M | 508 | 27 |
| 1542 Galaxy Drive | Newport Beach | 1964 | 7 | 5 | 5,218 | 18,321 | $1,724 | $8.99M | 60 | 27 |
| 1961 Port Cardigan Place | Newport Beach | 1970 | 5 | 7 | 3,311 | 8,362 | $2,688 | $8.90M | 200 | 26 |
| Total: 5 · Average | 4.6 | 4.8 | 3,796 | 10,432.4 | $2,539.8 | $9.24M | 187 | |||
| Median | 3,348 | $8.99M | ||||||||
Closed Properties (5)
Closed Comparables
| Address | City | Year | Date | BD | BTH | SqFt | LotSz | LP | SP | SP/SqFt | SP/LP | DIM | Score |
|---|---|---|---|---|---|---|---|---|---|---|---|---|---|
| 21 Lochmoor | Newport Beach | 1972 | 09/21/2026 | 5 | 8 | 6,293 | 9,500 | $8.75M | $8.75M | $1,390 | 1.00 | 207 | 30 |
| 1918 Santiago Drive | Newport Beach | 2025 | 04/22/2026 | 4 | 8 | 4,677 | 11,900 | $9.20M | $9.10M | $1,946 | 0.99 | 189 | 29 |
| 218 Evening Star | Newport Beach | 1964 | 10/02/2026 | 5 | 4 | 4,500 | 6,000 | $9.90M | $8.50M | $1,889 | 0.86 | 100 | 27 |
| 1941 Port Chelsea | Newport Beach | 2014 | 04/08/2026 | 5 | 6 | 4,345 | 7,280 | $8.99M | $9.20M | $2,117 | 1.02 | 57 | 26 |
| 17 Crooked Stick Drive | Newport Beach | 1999 | 05/13/2026 | 5 | 6 | 5,130 | 7,376 | $8.20M | $8.00M | $1,559 | 0.98 | 48 | 24 |
| Total: 5 · Average | 4.8 | 6.4 | 4,989 | 8,411.2 | $8.71M | $8.71M | $1,780.2 | — | 120.2 | ||||
| Median | 4,677 | $8.75M | $8.75M | ||||||||||
Market Analysis
List vs Sale $/SqFt
Sale Price Trend
Days on Market
Sale vs List Price
This analysis was generated automatically from MLS data. For an in-depth, human-reviewed valuation, contact Joseph Sardella at josephsardella@gmail.com.