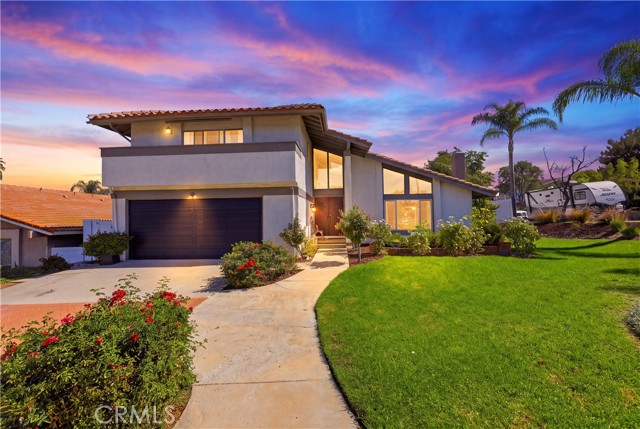
1 / 28
2065 West Ontario, Corona, CA 92882
$785K4bd · 3ba · 1,910 sqft
Lot 8,276 sqft•Single Family Residence•Active•28d on market•MLS# IV-26212806
2065 West Ontario, Corona, CA 92882
MLS# IV-26212806•Residential•Single Family Residence
Active28 days on market
$785,000
4
Beds
3
Baths
1,910
Sq Ft
8,276
Lot Sq Ft
1976
Year Built
None
View
Features & Amenities
FeeBuilt 1976
Property Details
Land Type
Fee
Year Built
1976
Property Type
Residential
Property Subtype
Single Family Residence
Parking Spaces
3
Garage Spaces
3
Heating
Central
Cooling
Central Air
View
None
Flooring
Vinyl, Tile
Roof
Tile
City
Corona
Zip Code
92882
County
Riverside
Mortgage Calculator
Current Rates
$
$
%
Monthly Payment
$3,969.39
Principal & Interest
Loan Amount
$628,000
Total Interest
$800,979
Total Payment Over 30 Years
$1,428,979
This calculator provides estimates only. Actual mortgage payments may include taxes, insurance, HOA fees, and PMI. Contact a lender for accurate quotes.
Comparative Market Analysis
Residential Tier · 5 active · 5 closed
2065 West Ontario, Corona, CA 92882
Corona · Single Family Residence
$785K
Residential TierBeds
4
Baths
3
Sqft
1,910
Lot
8,276 sqft
Year
1976
$/Sqft
$411
Pool: No✓
View: None✓
Garage: 3-car✓
Listed in line with the median closed sale of $789,000. Closed comps sold at 101% of list — strong seller's market.
Price Position
Aligned with the market — fair pricing for the comps.
At market
Subject listed at $785K· $411/sqft
Total list price
Closed comps
vs closed median $789K
−$4K (−0.5%)
Active comps
vs active median $825K
−$40K (−4.8%)
Price per sqft
Closed compsinsufficient comp data
Active comps
vs active avg $/sqft $446
−$35 (−7.9%)
Active Properties (5)
Active Comparables
| Address | City | Year | BD | BTH | SqFt | LotSz | LP/SqFt | LP | DIM | Score |
|---|---|---|---|---|---|---|---|---|---|---|
| 2391 Mangular Ave | Corona | 1988 | 4 | 3 | 2,273 | 7,405 | $370 | $839,999 | 92 | 80 |
| 1720 Sugar Pine Dr. | Corona | 1989 | 3 | 3 | 1,523 | 5,663 | $486 | $740,000 | 390 | 75 |
| 2411 Peacock Lane | Corona | 1977 | 3 | 2 | 1,562 | 7,841 | $528 | $825,000 | 18 | 75 |
| 1521 Classico | Corona | 1990 | 3 | 3 | 1,501 | 2,614 | $463 | $695,000 | 73 | 73 |
| 2421 Mangular | Corona | 1989 | 4 | 3 | 2,145 | 6,970 | $385 | $825,000 | 117 | 71 |
| Total: 5 · Average | 3.4 | 2.8 | 1,800.8 | 6,098.6 | $446.4 | $784,999.8 | 138 | |||
| Median | 1,562 | $825,000 | ||||||||
Closed Properties (5)
Closed Comparables
| Address | City | Year | Date | BD | BTH | SqFt | LotSz | LP | SP | SP/SqFt | SP/LP | DIM | Score |
|---|---|---|---|---|---|---|---|---|---|---|---|---|---|
| 1963 Ontario | Corona | 1980 | 06/05/2026 | 4 | 2 | 1,936 | 6,970 | $699,900 | $740,000 | $382 | 1.06 | 40 | 89 |
| 2046 Ontario | Corona | 1980 | 06/23/2026 | 3 | 2 | 1,689 | 8,276 | $740,000 | $746,000 | $442 | 1.01 | 53 | 87 |
| 1791 Moccasin Trail Circle | Corona | 1989 | 10/01/2026 | 5 | 3 | 2,065 | 6,098 | $840,000 | $850,000 | $412 | 1.01 | 63 | 86 |
| 2220 Bloomfield Lane | Corona | 1989 | 07/20/2026 | 4 | 3 | 2,182 | 6,098 | $864,900 | $864,900 | $396 | 1.00 | 178 | 84 |
| 2288 Avenida Del Vista | Corona | 1966 | 07/07/2026 | 4 | 2 | 1,440 | 6,970 | $789,000 | $789,000 | $548 | 1.00 | 62 | 83 |
| Total: 5 · Average | 4.0 | 2.4 | 1,862.4 | 6,882.4 | $797,980 | $797,980 | $436 | — | 79.2 | ||||
| Median | 1,936 | $789,000 | $789,000 | ||||||||||
Market Analysis
List vs Sale $/SqFt
Sale Price Trend
Days on Market
Sale vs List Price
AI-generated CMA
This analysis was generated automatically from MLS data. For an in-depth, human-reviewed valuation, contact Joseph Sardella at josephsardella@gmail.com.