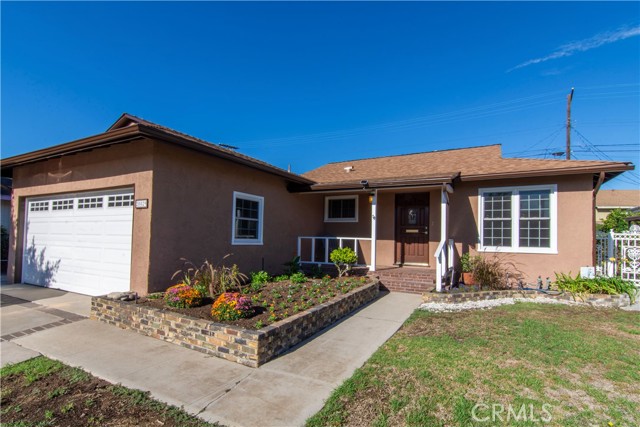
20029 Ingrum Way, Torrance, CA 90503
20029 Ingrum Way, Torrance, CA 90503
Property Description
Charming West Torrance home, where classic character meets thoughtful updates. Red oak hardwood floors flow throughout the home. Updated kitchen featuring custom cabinetry, granite countertops and tile flooring. The expanded primary retreat offers walk-in closet, private bathroom with shower, sitting area, and sliding door to the backyard deck. The home has been refreshed with interior paint, along with new flooring and vanity in the hall bath. Situated on a 5,388 sq. ft, lot with a two car garage, this well maintained home offers a wonderful opportunity in desirable West Torrance.
Features & Amenities
Property Details
Mortgage Calculator
Current Rates
Comparative Market Analysis
Affordable Tier · 5 active · 5 closed
Torrance · Single Family Residence
Listed in line with the median closed sale of $1,295,000.
Price Position
Aligned with the market — fair pricing for the comps.
Active Properties (5)
Active Comparables
| Address | City | Year | BD | BTH | SqFt | LotSz | LP/SqFt | LP | DIM | Score |
|---|---|---|---|---|---|---|---|---|---|---|
| 1226 Fonthill Avenue | Torrance | 1951 | 3 | 2 | 1,386 | 5,993 | $920 | $1.27M | 4 | 85 |
| 1004 Firmona | Redondo Beach | 1955 | 4 | 2 | 1,539 | 5,527 | $864 | $1.33M | 39 | 84 |
| 4757 Towers Street | Torrance | 1954 | 3 | 1 | 1,098 | 6,825 | $1,138 | $1.25M | 42 | 80 |
| 606 Phelan Lane | Redondo Beach | 1953 | 3 | 1 | 918 | 5,509 | $1,471 | $1.35M | 29 | 80 |
| 1809 Phelan Lane | Redondo Beach | 1957 | 3 | 2 | 912 | 3,003 | $1,343 | $1.23M | 38 | 77 |
| Total: 5 · Average | 3.2 | 1.6 | 1,170.6 | 5,371.4 | $1,147.2 | $1.29M | 30.4 | |||
| Median | 1,098 | $1.27M | ||||||||
Closed Properties (5)
Closed Comparables
| Address | City | Year | Date | BD | BTH | SqFt | LotSz | LP | SP | SP/SqFt | SP/LP | DIM | Score |
|---|---|---|---|---|---|---|---|---|---|---|---|---|---|
| 4540 Talisman Street | Torrance | 1954 | 09/25/2026 | 3 | 2 | 1,430 | 5,362 | $1.37M | $1.35M | $944 | 0.99 | 127 | 93 |
| 4619 Bulova Street | Torrance | 1954 | 07/14/2026 | 3 | 2 | 1,535 | 5,642 | $1.40M | $1.48M | $964 | 1.06 | 33 | 91 |
| 4620 Talisman | Torrance | 1954 | 06/09/2026 | 3 | 2 | 1,375 | 5,539 | $1.29M | $1.29M | $942 | 1.00 | 39 | 90 |
| 20005 Pruitt | Torrance | 1955 | 09/02/2026 | 3 | 1 | 1,119 | 6,422 | $1.24M | $1.24M | $1,107 | 1.00 | 42 | 90 |
| 4536 Toucan | Torrance | 1954 | 09/14/2026 | 3 | 1 | 1,143 | 5,207 | $1.25M | $1.13M | $989 | 0.90 | 41 | 90 |
| Total: 5 · Average | 3.0 | 1.6 | 1,320.4 | 5,634.4 | $1.30M | $1.30M | $989.2 | — | 56.4 | ||||
| Median | 1,375 | $1.29M | $1.29M | ||||||||||
Market Analysis
List vs Sale $/SqFt
Sale Price Trend
Days on Market
Sale vs List Price
This analysis was generated automatically from MLS data. For an in-depth, human-reviewed valuation, contact Joseph Sardella at josephsardella@gmail.com.