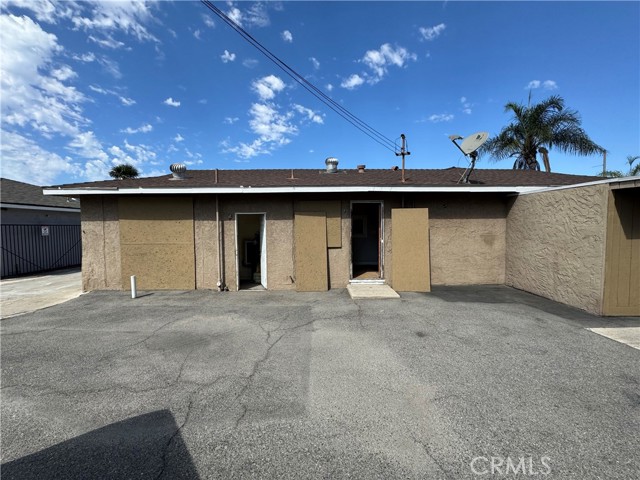
200 North Brookhurst, Anaheim, CA 92801
200 North Brookhurst, Anaheim, CA 92801
Property Description
Freestanding commercial building in west Anaheim, positioned on Brookhurst Street just north of Lincoln Avenue. The 1,480 SF structure was originally constructed in 1954 as a single-family residence and has been converted to commercial, offering a flexible floor plan that suits professional office, medical, legal, insurance, salon, or similar service users. The 0.14-acre lot (approximately 6,098 SF) provides up to 11 on-site parking spaces that accommodates staff and client traffic without relying on street parking, and supports uses with higher parking demand.
Features & Amenities
Property Details
Mortgage Calculator
Current Rates
Comparative Market Analysis
Affordable Tier · 5 active · 5 closed
Anaheim · Single Family Residence
Listed in line with the median closed sale of $825,000. Price per sqft ($563) is a 28% discount to closed comps ($782).
Price Position
Aligned with the market — fair pricing for the comps.
Active Properties (5)
Active Comparables
| Address | City | Year | BD | BTH | SqFt | LotSz | LP/SqFt | LP | DIM | Score |
|---|---|---|---|---|---|---|---|---|---|---|
| 2040 Embassy Ave | Anaheim | 1955 | 4 | 2 | 1,436 | 6,324 | $626 | $899,000 | 31 | 85 |
| 1917 Beacon | Anaheim | 1955 | 4 | 2 | 1,375 | 6,251 | $680 | $935,000 | 17 | 78 |
| 2381 Transit | Anaheim | 1956 | 3 | 2 | 1,358 | 7,930 | $699 | $949,000 | 37 | 77 |
| 413 FALCON Street | Anaheim | 1956 | 3 | 2 | 1,278 | 7,920 | $692 | $885,000 | 60 | 77 |
| 1986 Bayshore | Anaheim | 1977 | 2 | 2 | 1,461 | 4,072 | $546 | $798,000 | 44 | 77 |
| Total: 5 · Average | 3.2 | 2.0 | 1,381.6 | 6,499.4 | $648.6 | $893,200 | 37.8 | |||
| Median | 1,375 | $899,000 | ||||||||
Closed Properties (5)
Closed Comparables
| Address | City | Year | Date | BD | BTH | SqFt | LotSz | LP | SP | SP/SqFt | SP/LP | DIM | Score |
|---|---|---|---|---|---|---|---|---|---|---|---|---|---|
| 1943 Victoria | Anaheim | 1955 | 09/28/2026 | 4 | 2 | 1,441 | 6,161 | $950,000 | $950,000 | $659 | 1.00 | 33 | 83 |
| 230 Camellia | Anaheim | 1958 | 04/16/2026 | 4 | 2 | 1,429 | 6,120 | $949,900 | $925,000 | $647 | 0.97 | 120 | 80 |
| 300 Ranchito Street | Anaheim | 1952 | 09/29/2026 | 3 | 1 | 896 | 7,280 | $769,000 | $765,000 | $854 | 0.99 | 148 | 78 |
| 207 Ranchito | Anaheim | 1952 | 06/30/2026 | 3 | 2 | 896 | 7,280 | $799,900 | $825,000 | $921 | 1.03 | 67 | 78 |
| 209 Dahlia Drive | Anaheim | 1953 | 04/02/2026 | 3 | 1 | 998 | 7,222 | $868,000 | $825,000 | $827 | 0.95 | 69 | 73 |
| Total: 5 · Average | 3.4 | 1.6 | 1,132 | 6,812.6 | $858,000 | $858,000 | $781.6 | — | 87.4 | ||||
| Median | 998 | $825,000 | $825,000 | ||||||||||
Market Analysis
List vs Sale $/SqFt
Sale Price Trend
Days on Market
Sale vs List Price
This analysis was generated automatically from MLS data. For an in-depth, human-reviewed valuation, contact Joseph Sardella at josephsardella@gmail.com.