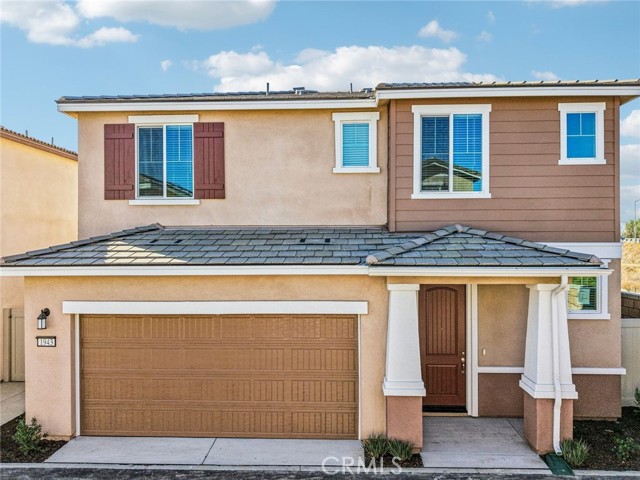
1943 Limetta Lane, Redlands, CA 92374
1943 Limetta Lane, Redlands, CA 92374
Property Description
Brand new, energy-efficient home! Homeowners will love the impressive walk-in closet located just off the primary suite bathroom. Sizeable secondary bedrooms are ideal for kids or home office. The spacious great room flows seamlessly into the dining and kitchen to create an open feel. Laurel offers two-story, single-family homes with large living spaces, chef-inspired kitchens, luxurious primary suites and flexible lofts. Every home includes backyard landscape, Whirlpool® appliances including refrigerator & W/D, whole-home blinds energy-efficient features, designer-curated finishes and smart home technology. Each of our homes is built with innovative, energy-efficient features designed to help you enjoy more savings, better health, real comfort and peace of mind.
Features & Amenities
Property Details
Mortgage Calculator
Current Rates
Comparative Market Analysis
Residential Tier · 5 active · 5 closed
Redlands · Single Family Residence
Listed 5.8% above the median closed sale of $566,000.
Price Position
Positioned above the market — commands a premium.
Active Properties (5)
Active Comparables
| Address | City | Year | BD | BTH | SqFt | LotSz | LP/SqFt | LP | DIM | Score |
|---|---|---|---|---|---|---|---|---|---|---|
| 1951 Limetta Lane | Redlands | 2026 | 3 | 3 | 1,815 | 3,500 | $347 | $629,000 | 72 | 97 |
| 1939 Limetta Lane | Redlands | 2026 | 4 | 3 | 2,125 | 3,500 | $310 | $659,000 | 69 | 91 |
| 1955 Limetta Lane | Redlands | 2026 | 4 | 3 | 2,125 | 3,500 | $319 | $678,500 | 72 | 91 |
| 1664 Camellia Lane | Redlands | 2022 | 4 | 3 | 2,010 | 4,165 | $323 | $649,999 | 58 | 87 |
| 1505 Canterbury | Redlands | 1988 | 5 | 4 | 2,388 | 8,100 | $268 | $640,888 | 45 | 62 |
| Total: 5 · Average | 4.0 | 3.2 | 2,092.6 | 4,553 | $313.4 | $651,477.4 | 63.2 | |||
| Median | 2,125 | $649,999 | ||||||||
Closed Properties (5)
Closed Comparables
| Address | City | Year | Date | BD | BTH | SqFt | LotSz | LP | SP | SP/SqFt | SP/LP | DIM | Score |
|---|---|---|---|---|---|---|---|---|---|---|---|---|---|
| 1960 Limetta Lane | Redlands | 2026 | 09/25/2026 | 3 | 3 | 1,684 | 3,500 | $594,000 | $594,000 | $353 | 1.00 | 94 | 99 |
| 1947 Limetta Lane | Redlands | 2026 | 10/22/2026 | 3 | 3 | 1,465 | 3,500 | $566,000 | $566,000 | $386 | 1.00 | 62 | 97 |
| 1956 Limetta Lane | Redlands | 2026 | 09/17/2026 | 3 | 3 | 1,465 | 3,500 | $569,000 | $564,000 | $385 | 0.99 | 86 | 96 |
| 1138 Tropic Court | Redlands | 2026 | 07/24/2026 | 3 | 3 | 1,648 | 3,500 | $565,000 | $565,000 | $343 | 1.00 | 92 | 96 |
| 1151 Tropic Court | Redlands | 2026 | 10/13/2026 | 3 | 3 | 1,815 | 3,500 | $655,055 | $629,000 | $347 | 0.96 | 119 | 96 |
| Total: 5 · Average | 3.0 | 3.0 | 1,615.4 | 3,500 | $583,600 | $583,600 | $362.8 | — | 90.6 | ||||
| Median | 1,648 | $566,000 | $566,000 | ||||||||||
Market Analysis
List vs Sale $/SqFt
Sale Price Trend
Days on Market
Sale vs List Price
This analysis was generated automatically from MLS data. For an in-depth, human-reviewed valuation, contact Joseph Sardella at josephsardella@gmail.com.