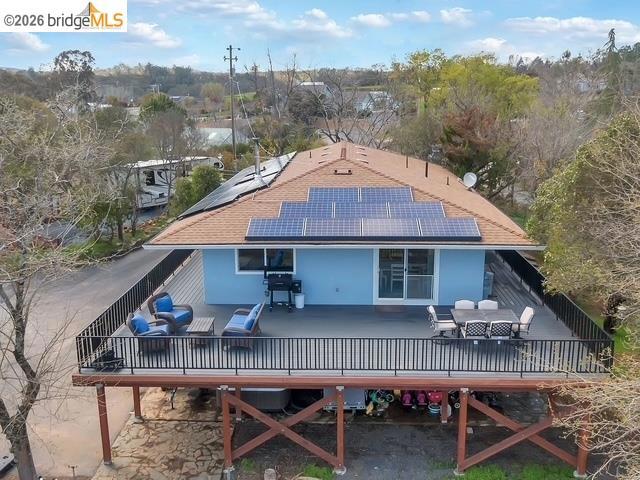
1841 Hoko CT, Copperopolis, CA 95228
1841 Hoko CT, Copperopolis, CA 95228
Property Description
Situated on 1.5 acres in a cul-de-sac, this 3-bedroom, 3-bath home offers two bonus rooms with options for an office and downstairs living area, or potential conversion into two additional bedrooms. Both bonus rooms have closets and windows, offering possibilities for a five-bedroom layout, that already has been permitted as a 5 bedroom 3 bath. Three paddocks are ready for animals. Rooftop solar has been removed; however, a propane-connected Generac provides backup power. HOA amenities include lake and park access, plus complimentary use of the local transfer station for garbage disposal. Convenient bus stop at the end of the cul-de-sac.
Features & Amenities
Property Details
Mortgage Calculator
Current Rates
Comparative Market Analysis
Residential Tier · 1 active · 3 closed
Copperopolis · Single Family Residence
Listed in line with the median closed sale of $561,000. Price per sqft ($257) is a 12% discount to closed comps ($292).
Price Position
Aligned with the market — fair pricing for the comps.
Active Properties (1)
Active Comparables
| Address | City | Year | BD | BTH | SqFt | LotSz | LP/SqFt | LP | DIM | Score |
|---|---|---|---|---|---|---|---|---|---|---|
| 158 Rock Ridge Ln | Copperopolis | 2002 | 2 | 3 | 2,652 | 12,632 | $248 | $659,000 | 187 | 55 |
| Total: 1 · Average | 2.0 | 3.0 | 2,652 | 12,632 | $248 | $659,000 | 187 | |||
| Median | 2,652 | $659,000 | ||||||||
Closed Properties (3)
Closed Comparables
| Address | City | Year | Date | BD | BTH | SqFt | LotSz | LP | SP | SP/SqFt | SP/LP | DIM | Score |
|---|---|---|---|---|---|---|---|---|---|---|---|---|---|
| 106 Glen View Ct | Copperopolis | 2006 | 01/30/2026 | 3 | 3 | 2,658 | 11,761 | $574,950 | $560,000 | $211 | 0.97 | 108 | 51 |
| 121 Blue Oak Ct | Copperopolis | 2018 | 09/15/2025 | 3 | 3 | 2,099 | 16,552 | $615,000 | $600,000 | $286 | 0.98 | 14 | 51 |
| 660 Hodson Rd | Copperopolis | 2003 | 06/22/2026 | 3 | 2 | 1,480 | 815,878 | $559,000 | $561,000 | $379 | 1.00 | 175 | 40 |
| Total: 3 · Average | 3.0 | 2.7 | 2,079 | 281,397 | $573,666.667 | $573,666.667 | $292 | — | 99 | ||||
| Median | 2,099 | $561,000 | $561,000 | ||||||||||
Market Analysis
List vs Sale $/SqFt
Sale Price Trend
Days on Market
Sale vs List Price
This analysis was generated automatically from MLS data. For an in-depth, human-reviewed valuation, contact Joseph Sardella at josephsardella@gmail.com.